As a newcomer to the world of Digital Analytics, things can be a little overwhelming. You’re introduced to a myriad of feature-rich tools used to perform a multitude of operations on data and you struggle to understand what’s what and why are things the way they are.
Being someone who likes working with data (although that doesn’t necessarily mean I’m well acquainted with the art), I was looking forward to working with actual datasets after fetishizing the job of a ‘data analyst’ for nearly 4 years at university.

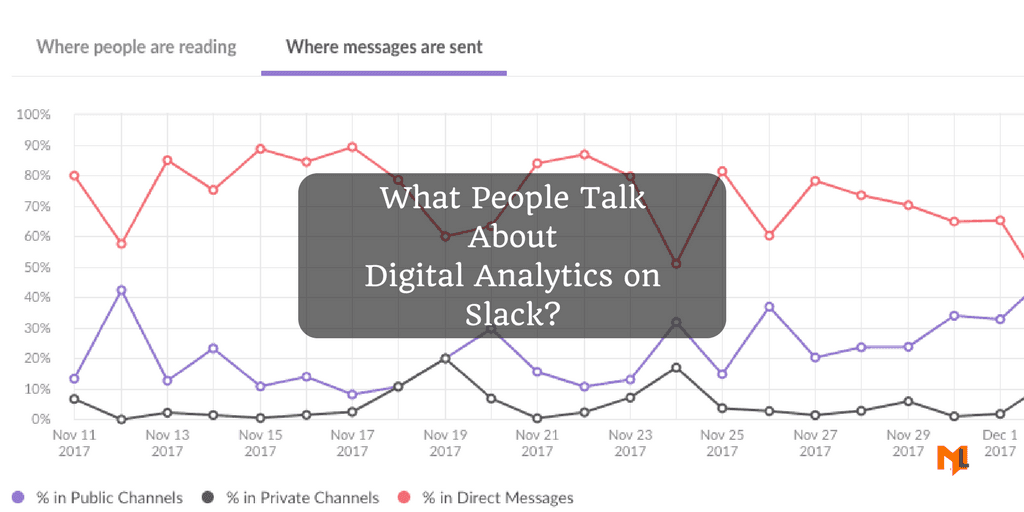
The first dataset I was given to work with consisted of 35,000 messages (ranging from January to November 2017) from a slack group called ‘Measure’.These messages are only from public channels, which is only a small subset of total messages which are primarily direct messages.
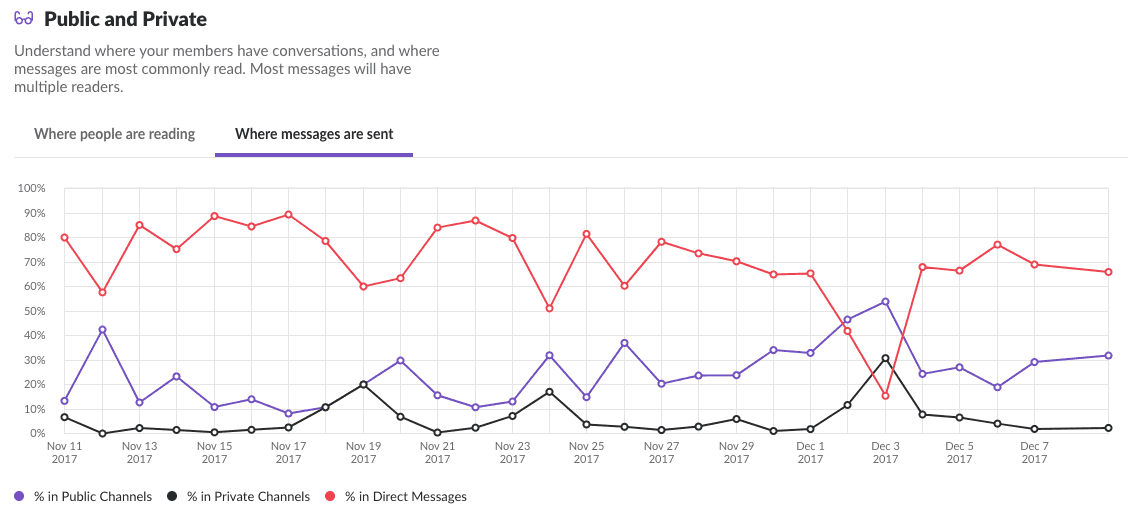
This slack group is generally considered as common grounds for the Digital Analytics community to talk about data, analytics, and tools used for this analysis. Agreed that in terms of volume and veracity (ambiguity, bias of data), this was not the right dataset for an in-depth analysis but I gathered it would be enough to get a basic snapshot of the what is happening right now in the Digital Analytics community. Furthermore, it was my first time working with a real-life dataset so I was more than a little excited.
And so without much forethought, I jumped right into the pool (of data of course). Writing scripts in R and Python (languages I had/have very little experience with) to clean the data and bring it to a presentable and analyzable form while gently headbanging to Audioslave and Nirvana in the office as my new colleagues tried not to judge. The dataset was only 17.8 MB, but it took me around 40 hours just to make it clean enough for analysis. The analysis, although generally considered easier than cleaning the data took me even longer. What promulgated this phase of the project, even more, was the fact that half-way through said analysis, I realized that the data was extremely positively skewed (rookie mistake, I must confess). 4% of the users were responsible for 51% of the messages sent on the global (more on that later) channels.
However, this too as I later realized was more a feature of the data and not a defect. What follows is my attempt at extracting some form of meaningful insight from the dataset.
ANALYSIS
The channels are divided into two categories, global and local. Global channels discuss analytics irrespective
The group Measure is divided into different channels, each channel is tailored to serve the digital analyst community in a different way. From software specific channels like ‘google-analytics’ and ‘adobe-analytics’ to channels championing a cause like ‘women-in-analytics’, there are a total of 35 channels in this group, out of which 22 global channels are logged. The local channels like ‘local-asia’ and ‘local-london’, are not logged by the group admins.
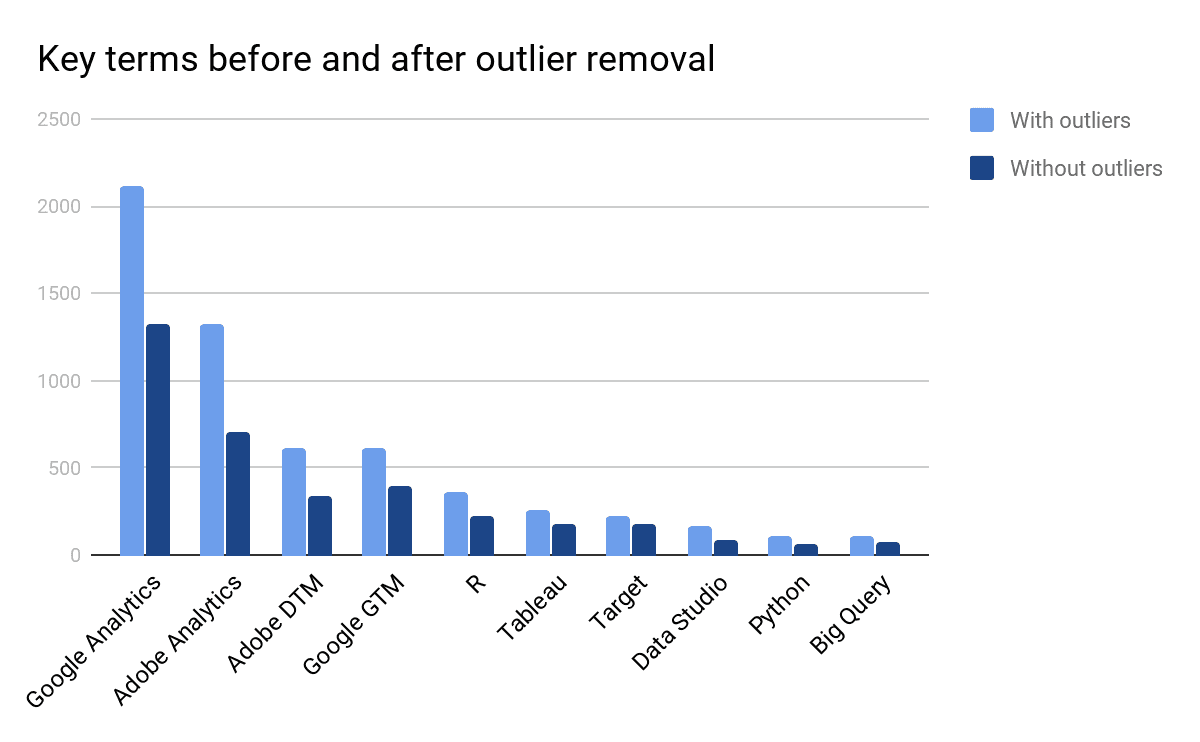
In order to determine the popularity of the channels, the total number of messages in each channel were found.
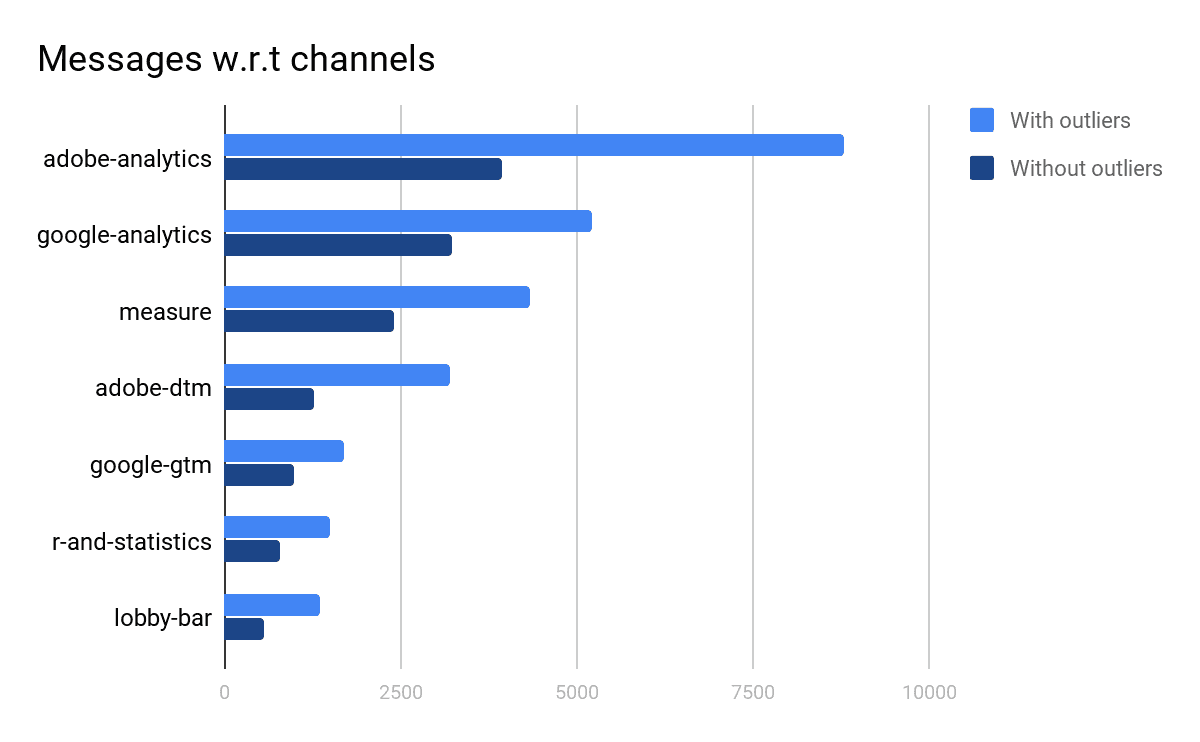 Most popular channels and the total number of messages in those channels, the only notable difference is that the difference between adobe-analytics and google-analytics has significantly decreased after outlier removal.
Just the number of messages can be a misleading metric so the total number of unique users must also be taken into account.
| Channel | Unique Users(Including Outliers) | Messages(Including Outliers) | Unique Users(Excluding Outliers) | Messages(Excluding Outliers) |
|---|---|---|---|---|
| Adobe Analytics | 279 | 8788 | 253 | 3923 |
| Google Analytics | 340 | 5200 | 312 | 3219 |
| Measure | 470 | 4321 | 433 | 2407 |
| Google Tag Manager | 176 | 3211 | 159 | 1262 |
| Adobe DTM | 128 | 1704 | 108 | 991 |
| R and Statistics | 87 | 1497 | 76 | 799 |
| Lobby Bar | 196 | 1371 | 166 | 558 |
- total users (including outliers): 948
- total users (excluding outliers): 910
- one user can be in multiple channels.
Although there are a number of messages in the Adobe Analytics (AA) channel we can see that number of users in Google Analytics (GA) is considerably higher. GA has 35.8% of the total users (including outliers) while AA has 29.4%. What’s interesting to note is that the R and Statistics (RS) channel has only 9.1% of the total users.
What we can infer, if we were to assume that this dataset is representative of the digital analytics community (which it clearly isn’t), is that the majority of the community is divided between GA and AA as a primary analytics platform. Although there are more users added to the GA channel, there are more messages in the AA channel. What is interesting to note is that very few people rely on using external tools like R or Python, which could mean one of two things:
a) AA and GA are complete and comprehensive tools which are complete unto themselves, or b) the analytics community is dominated by marketers as opposed to relatively ‘hardcore’ techies who prefer to ‘sweat’ to get results.
The case for Lobby-bar
As mentioned before, 4% of the users were contributing the majority traffic in all channels. On removing these extra chatty users, the ranking with respect to the number of messages remains the same for all our top channels, except for Lobby-bar. 3 channels precede Lobby-bar after outlier removal, these channels are ‘testing’, ‘blogs-and-podcasts’, and ‘conferences’. However, when it comes to users after removal of outliers, lobby-bar still precedes the channels mentioned above. The following table is populated after outlier removal.
| Channel | Users | Messages |
|---|---|---|
| Lobby Bar | 166 | 558 |
| Conferences | 164 | 572 |
| Blogs-and-Podcasts | 137 | 587 |
| Testing | 89 | 708 |
This only goes to show how an unreliable number of messages is as a metric for determining the popularity of a channel. Lobby-bar is generally understood as a channel for random discussions so it can be assumed that a few users (outliers) were responsible for most the chatter, our analysis to a large extent confirms this assumption. Since the number of users is a far more reliable metric, we considered lobby-bar to be a more active channel.
Understanding the skew
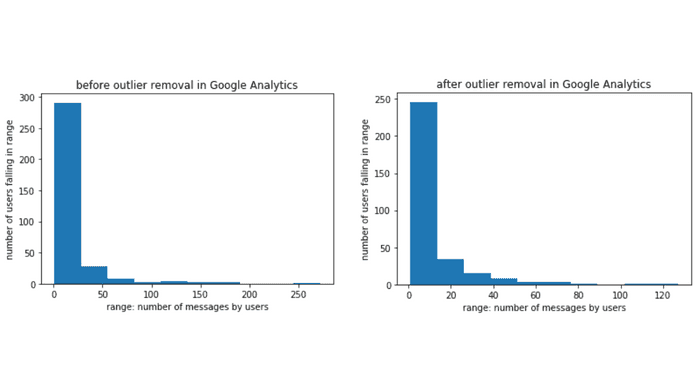
The data as mentioned previously was positively skewed. Rather than treating this as a flaw, we shall attempt to treat this as a feature to aid us in our analysis. However, in order to ensure that this skew persists through our data at a more granular level, we attempted to analyze each channel to see if the data has similar properties.
Adobe Analytics

Google Analytics
Google Tag Manager
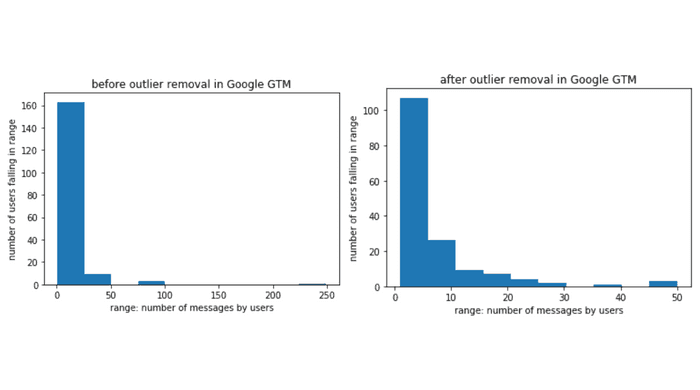
The histograms above are aligned with our initial findings, we see that the positive skew persists throughout all of our major channels. This can lead us to the following conclusions:
- Users from one channel do not overly dominate the traffic in the group
- Some users are more active than others.
The second conclusion is characteristic of most social platforms, and our group most closely identifies as a ‘Software Engineering Social Network’. Like most social media, the content is user-generated. But in this case, the users are people who instead of discussing makeup tips actually work with marketing data. Any such forums where help is given and taken qualifies as Software Engineering Social Network. The most common example of such a network is Stackoverflow; a question and answer site for professional and enthusiast programmers.
Adobe and Google
What is evident from the data provided is that Google and Adobe are the two main players when it comes to analytics.
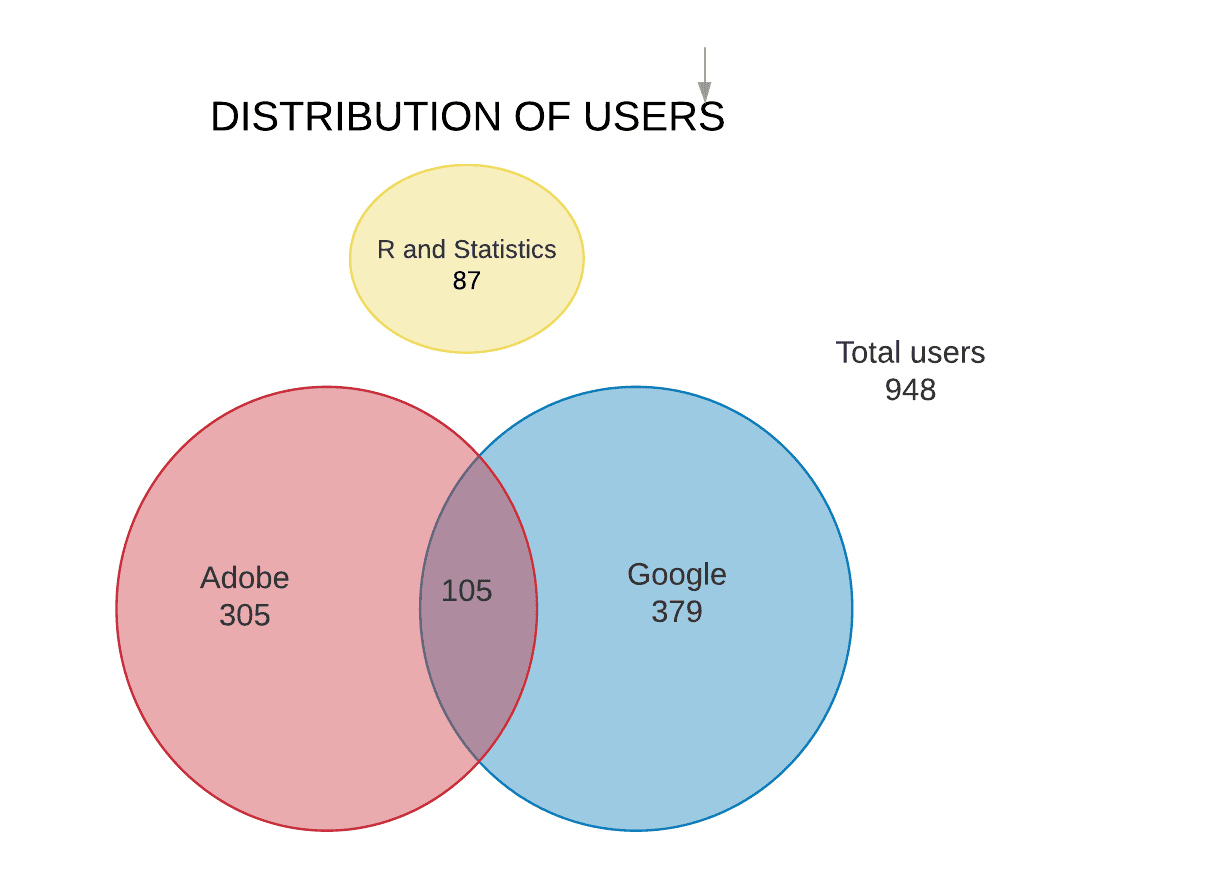 Adobe = AA + DTM, Google = GA + GTM
Our analysis found some overlap between Google and Adobe Product users, there are only 105 users which constitute only 11.07% of our total users. What’s worth mentioning here is that not all of our users are in these channels. Such users constitute 38.93% of the total users, which can lead us to believe that this segment of the population uses other tools/platforms for their analysis needs. Some other tools which are used by the community for analytics include; Kissmetrics, Mixpanel, Clicky, Parse.ly, Piwik etc.
The R and statistics channel has very few users, only 9.1% of our total user base of 948. What’s interesting to note is the fact that there is no overlap in the users of Google, Adobe product-specific channels and this channel. This could mean one of two things:
- These products are complete and there’s no need for third-party tools.
- Most Digital Marketeers and Analysts are not proficient at programming
This is something which was particularly interesting for me since previously I thought that most data was analyzed on R or Python, I had greatly underestimated the power of tools like Google Analytics.
Digging Deeper
So far our analysis provided us with a very shallow overview of our data. In order to better understand the community, we needed to go into more depth. And to reach the necessary depth, Named Entity Extraction was done using the Natural Languages Toolkit (NLTK) on messages from the dataset.
Named-entity recognition (NER) (also known as entity identification, entity chunking and entity extraction) is a subtask of information extraction that seeks to locate and classify named entities in text into pre-defined categories such as the names of persons, organizations, locations, expressions of times, quantities and in our case; Analytics tools/platforms. Software-specific NER is still a pain area in the analytics community as most NER methods are centered around recognizing a person, location, and organization in formal and social texts, which are not applicable in our case. This paper presented at an IEEE conference in Suita Japan, March 2016 talks about the problem, and possible solutions in more depth.
As we can see, the lion’s share still belongs to the Google and Adobe, however through this graphic we learned that the community is using other Google products like Google Data Studio and Google Big Query which shows that Google’s dominance in the market is more than what we had initially estimated; what compliments this finding is the fact that although the Adobe Analytics channel has more messages in total, Google Analytics as a Named Entity is mentioned more across all channels.
The NER libraries of NLTK have not been designed for software specific named entity recognition, tools for this specific purpose have not been developed yet. Keeping this in mind, the exact number of entities detected might be erroneous in our analysis. However, the ranking is important and our analysis is based on the rank rather than the number.
What tool is better is a rather complex question to ask, the answer to which largely depends on the size and type of your operation and the amount of money you can spend on analytics (considering there’s no free version of Adobe Analytics). Deciding what tool is better is not the purpose of our analysis; however, an easy way for an outsider like me understand how well the users of each tool understand the tool they’re using is to identify the number of questions being asked about the tool in question. Through simple parsing, we were able to separate and analyze the messages in which questions were asked. The number of question marks in each message was calculated and any message which had more than one question mark was considered a question.
We must understand that this slack group is not the Q&A forum for Google or Adobe. Google has its user forums and Adobe, being a paid product comes with customer support and a users’ forum. The following is only an attempt to understand the dataset at a relatively more deeper level.
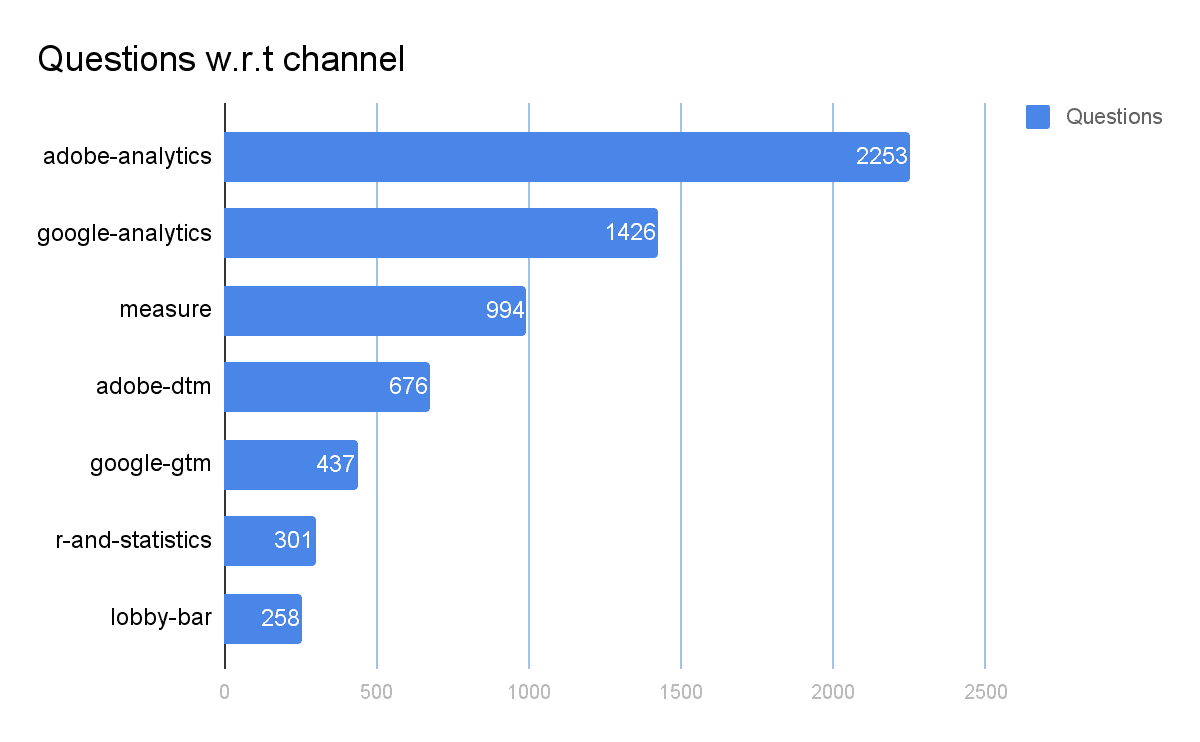
The highest number of questions have been asked in the Adobe Analytics channel, followed by Google Analytics and Measure. This is understandable since the number of questions asked is positively correlated with a number of messages in a group (number of questions increases with the number of messages), however, if we take into account the fact that Adobe Analytics is not a free software and comes with supposedly excellent customer support, this is rather confusing. To put these findings into context, it is important to find the question to user ratio.
| Channel | Questions: Users |
|---|---|
| Adobe Analytics | 8.07 : 1 |
| Google Analytics | 4.19 : 1 |
| Measure | 2.11 : 1 |
| Google GTM | 2.48 : 1 |
| Adobe DTM | 5.28 : 1 |
| R and Statistics | 3.45 : 1 |
| Lobby Bar | 1.31 : 1 |
The ratios only confirm our previous hypothesis, that users of Adobe Products are asking more questions. This following conclusion could be drawn from this finding:
- Google products are easier to use
- Adobe products are more difficult to use
However, this might also reflect that only the members of this particular slack group find Google products easier to use and Adobe products difficult.
Once more unto the breach
Analyzing just the number of questions in a channel lacks the depth that we can achieve through NLP. In order to reaffirm or negate our hypothesis, it is worth asking the key-terms or Software Specific Named Entities in the questions asked.
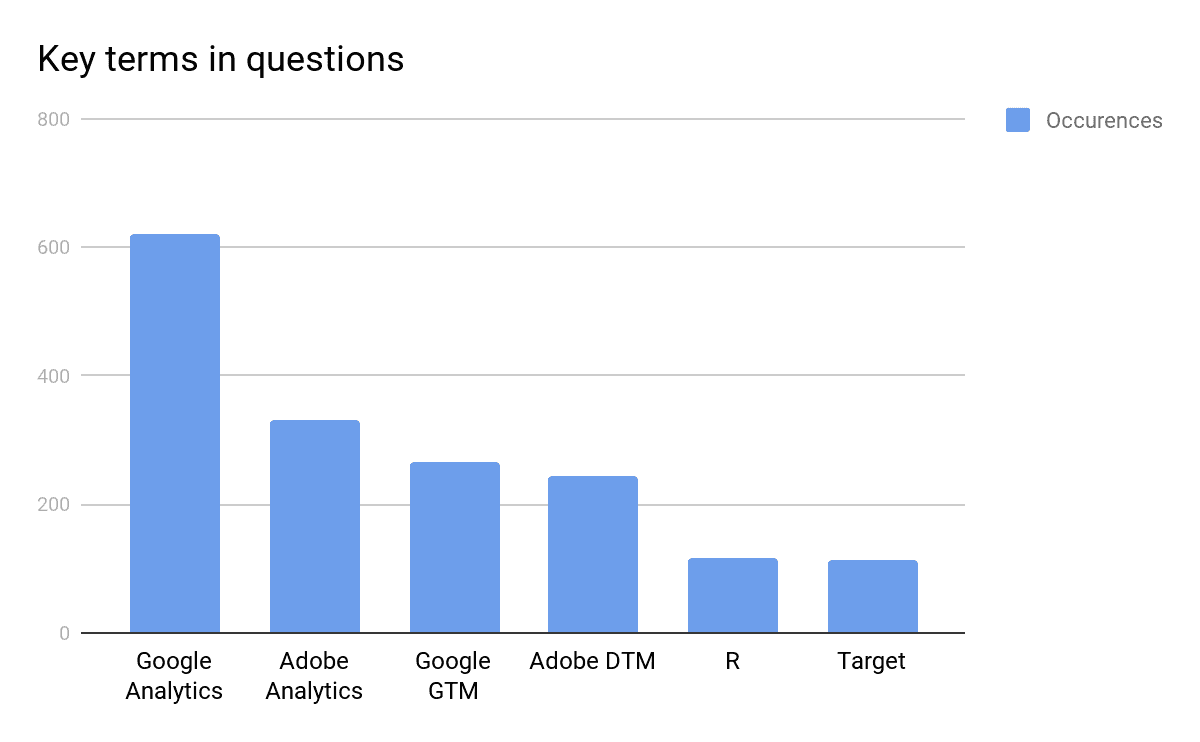
Our findings are aligned with our attempt to extract Named Entities from the dataset i.e although there are more messages in the Adobe Analytics channel, more questions have been asked about Google Analytics. As mentioned beforehand, the NLP libraries of NLTK are not designed for this purpose. The ranking is important, not the exact number.
Conclusion
With only a 17.8 MB JSON file and a considerable amount of effort (70+ hours), we were able to understand the Digital Analytics community more thoroughly even if it was only quantitatively. This only goes to show that a lot can be understood from seemingly small sets of data, and when fully harnessed this data can give us a pretty good idea, if not the complete picture, about how things (Digital Analytics in this case) work.
With special thanks to Lee Isensee who provided access to the raw data from Mixpanel and kindly reviewed multiple versions of this post.