

Chapter 2- Uncover Insights
On 25th July 2018, Pakistan witnessed its 13th General Election, after the completion of a 5-year tenure by the PML-N government. At the national level, from a total of 272 constituencies, the election was held on 270 of them. Polling was suspended by the Supreme Court in NA-60 and NA-103.
Today, we will be digging into the data of the general elections held in Pakistan from 1993 to 2018, uncovering insights and comparing how successful or unsuccessful the election of 2018 was as compared to the previous in terms of turnout and the votes discarded.
“Total 54 Million votes were cast in Pakistan on 25th July 2018”
 Yellow – Voters Registered Red – Votes discarded Green- Votes validated
Out of a total of 104.6 million registered voters in Pakistan, only 54.2 million people cast their vote in election 2018. Similar to previous elections, Punjab is the largest province with the highest population count and contributed the most to the votes cast. However, with the increase in population count the increase in votes cast is bound to happen. Thus a better measure to compare the increase in population and votes cast would be voter turnout.
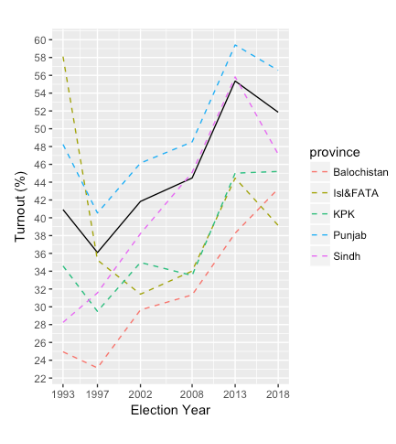 T he black line represents the overall turnout in Pakistan
Pakistan has always been a state with low voter turnout which was 41% on an average, till 2008. It increased to 44.8% in 2013 and to 46.47% by 2018. Whereas, the voter turnout has decreased from 55% in 2013 to 51.85% in 2018.
The similarity in the line graph for Punjab and overall turnout in Pakistan depicts how it directly affects the overall turnout for the country, making it a vital province. We can say, that the drop in overall turnout is because of the low turnout in Punjab this year.
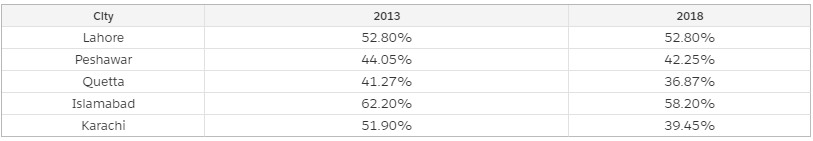
Interestingly, for the first time since 1993, Sindh experienced a massive drop of 9% in voter turnout in 2018 from 56% to 47%. This is majorly because of the decrease in turnout in the capital city, Karachi, which has the highest number of constituencies and population. The turnout dropped from 51.9% to 39.55%.
Islamabad & FATA also experienced a decrease of around 5% in voter turnout. While the rest of the country witnessed a drop, the turnout in Balochistan increased by 5% and remained constant in KPK.
The turnout in the capital cities of the provinces was also less as compared to 2013 except for Lahore, which remained constant.
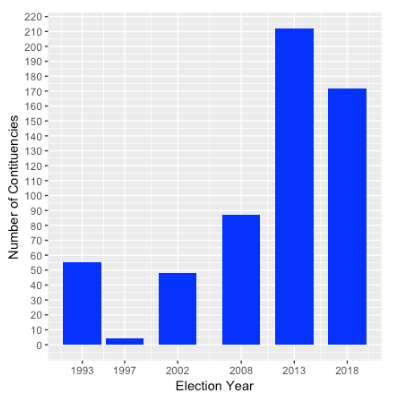
Next, I decided to compare how many constituencies in Pakistan have a turnout of 50% or more each year. In 2013, the year when Pakistan had the highest overall turnout, around 212 out of 272 constituencies had a turnout greater than or equals to 50%.
“In 2018, only 172 out of 272 constituencies had a turnout of 50% or more.”
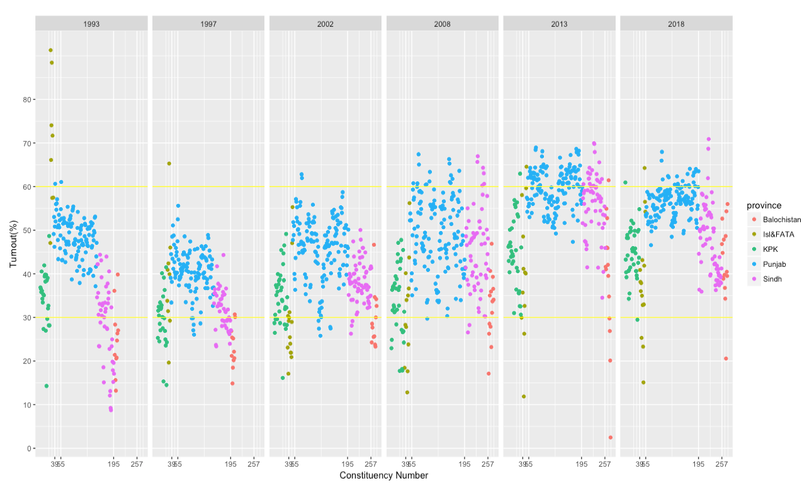
If we take a look at the overall distribution, we can notice a decrease in most of the constituencies of Punjab and Sindh in 2018 that had a turnout more than 60% in 2013. In 2013, 3 constituencies from Islamabad and FATA region, and 4 from Balochistan had a turnout less than or equal to 30%. in 2018, total 5 constituencies had a turnout less than 30%. (excluding NA 263 and NA 39)
“Tharparkar (NA 222) in Sindh had the highest turnout of 70.9% in 2018”
Surprisingly, Tharparkar, the largest district of Sindh province by land area, with the lowest Human Development Index of all the districts in Sindh had the highest voter turnout in Pakistan in 2018. In NA 222 from 33,1872 registered voters, 23,5340 cast their votes out of which 5.5% votes were discarded. The second highest turnout(68.68%) recorded also belongs to Tharparkar district (NA 221). Both the seats were won by Pakistan People’s Party Parliamentarians.
“1.89 votes on average were cast across Pakistan per minute in each polling booth”
As mentioned above, a total of 54.2 million votes were cast in Pakistan across 85307 polling stations in a duration of 10 hours. Each polling station had at least 2 polling booths, one for men and the other for women. So we had minimum 170614 polling booths all across Pakistan. Dividing the total votes by the number of polling booths and further dividing 600 minutes by that value tells us that on an average 317.676 votes were cast in each polling booth and thus, around 1.89 (approximately 2) votes were cast in Pakistan in each minute per polling booth.
After a detailed analysis of the turnout trends in Pakistan, let’s head towards the rate of votes rejected each year.
“Around 1.67 Million votes were rejected by ECP officials in the election of 2018”
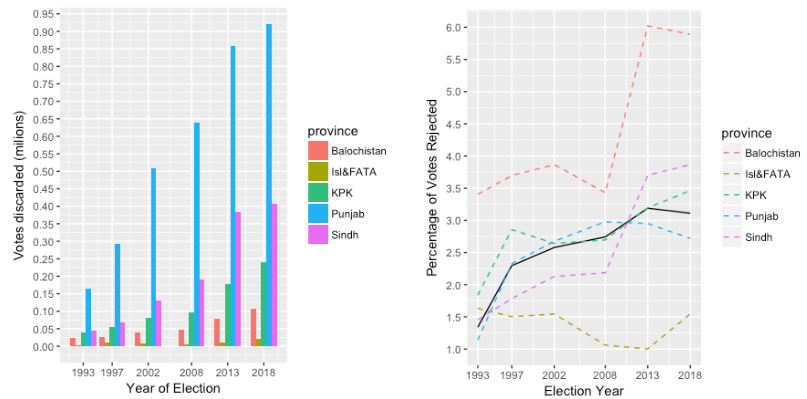 The black line represents the overall trend across Pakistan for votes discarded
2018 was the year with the highest number of votes rejected by ECP. Out of 1.67 million rejected votes, 0.92 million belonged to Punjab only. However, considering the increase in population count and the votes cast, these figures might be misleading. The second plot on the right indicates the percentage of votes discarded in each province over the years. It indicates that Pakistan had almost the same percentage of discarded votes in 2013 and 2018 i.e around 3.1- 3.2%. There’s has been no improvement in this regard.
“Balochistan has always had the highest percentage of votes discarded.”
We can observe that the percentage of votes discarded in Balochistan is almost the same as in 2013. Thus, it maintains its position on the top with around 5.8% votes discarded.
“19.92 votes on average were discarded per polling station across Pakistan”
1.67 million votes across 85,307 polling stations for 270 seats in Pakistan were discarded. If we divide these values, we can deduce that 19.57 votes were discarded on an average in each station while 6,231 votes were discarded per seat.
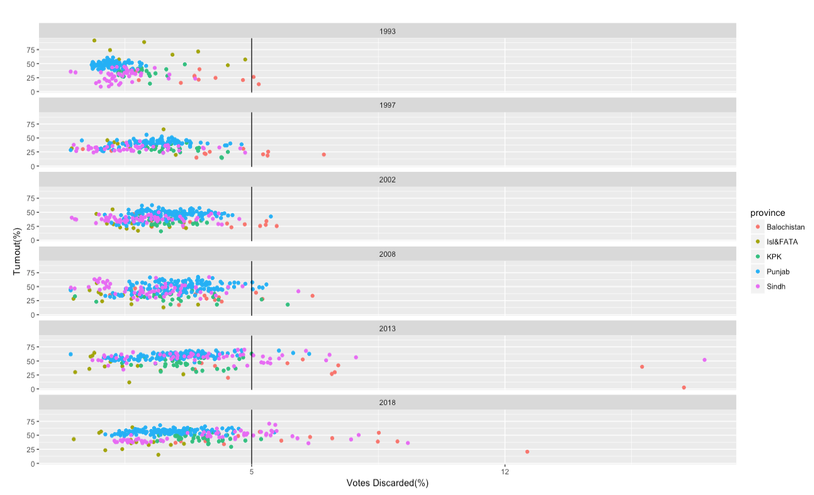
As we can see, the distribution spreads along the x-axis which indicates that the percentage of rejected votes has gradually gone up since 1993. In 2013, 24 constituencies had more than 5% of their votes discarded while in 2018, the number of constituencies increased to 26. The lowest percentage of votes discarded was 0.085% recorded in NA-46 Tribal Area. While the highest was 12.6% in NA-268 Chagai cum Nushki cum Kharan (Balochistan)
“The number of discarded votes exceeded the margin of victory in 48 constituencies in 2018”
he increase in the number of discarded votes is alarming. In 2008, there were a total of 45 constituencies in Pakistan where the discarded votes were exceeding the votes that determined the victory. By 2013, this number decrease to 34. Whereas, in 2018, there are 48 such constituencies, hitting an all-time high.
Conclusion
From the aforementioned insights, we can conclude that the election of 2018 was not as successful as 2013. The electoral scenario may have improved a bit in Balochistan, there was no improvement in terms of overall turnout or discarded votes across Pakistan. The turnout decreased by 3.2 percent, the percentage of votes discarded remained constant, and for 48 constituencies the rejected votes exceeded the margin of victory.
The high rate of discarded votes is disturbing and raises a lot of questions. Why are these votes rejected by ECP officials in the first place? Who would have won if those votes weren’t discarded?
This analysis of data was based on data collected from ECP’s website. It doesn’t include NA 103, NA 61 because of the suspension of polling in those constituencies. Furthermore, the votings statistics for NA 263 and NA 39 were eliminated as they were wrongly mentioned on the website.