Analytics debugging could be a very panic-inducing process once an issue is discovered. It’s more or less a hair on fire situation to find the issue and a way to fix it. This process can take from a few hours to few days depending on the data you debug and the tools you are using.
As a consultant figuring out a right method to perform this action is necessary especially since you are often working with client developers and not interacting with the code or limited in what you have access to. That means you only have to focus on doing it the right way so you can save time but also be able to point people to where the error might be.
To help you figure out this process, I will discuss various approaches and access points you have available to debug in the browser, how you should go about the process and what tools you can use.
Analytics Debugging, Why?
- Make sure data is accurate
It is important to make sure the data you capture is accurate otherwise it will be a waste of time and resources you put to capture data.
- We can trust decision made from data
The second reason for doing a debug is to make sure we can easily make the decisions based on data and the data needs to be accurate for this.
This could be one of the time-consuming processes, because on the implementation level you might be using an existing template or something that automates this step.
Debug, Where?
Where can you debug the data? There are multiple stages through which the data passes to reach the final tool. Below are stages through which the data passes:
- Source data
There will always be a source from where the data is coming through. Generally, the data is saved within databases but the data we see is in browsers. We do not work with databases to pull the data so the source data for us will be in the browser. You can see the source code by right-clicking on the page and click on ‘view source code’ option.
Source data is generally coming from a backend server which is written in a programming language like PHP or python.
- Code used to extract data or send it to platform
This would be the front-end code and is generally written in a language like JavaScript. This is generally a pages DOM and its also where most pixels and analytics tools live they consume data from the page and send it to the platform.
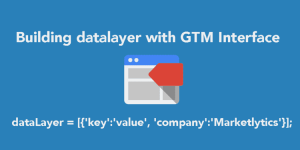
- Intermediary data management platform(GTM, Segment)
The intermediary data management tools have made our lives easier by eliminating the above two steps. Now we import the data directly to Google Tag Manager or Segment and use built-in functions and variables to send the data to the destination tool.
- Final tool consuming data
This is the tool where we want to see the data. The data we see in this tool should be accurate and trustworthy so we can make decisions.
Before starting to read the actual process, we recommend that you install the Google Analytics & GTM chrome extensions. Few the essential extensions you will need for debugging are:
Data Pipeline
Next, you have to look at the data pipeline. The place where the data exists and how it transmits to the analytics tool. For a website possible points included in the data pipeline would be:
- Server
- Browser
- Tag management solution(optional)
- Analytics
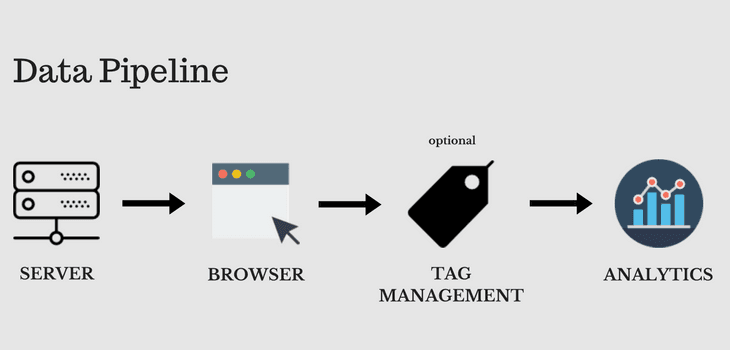
Generally, when debugging we do not work with anything on the server-side, so the possible ways to debug data would be in the browser or tag management if used.

When we work with the above pipeline, the best practice is to start from the initial step. Usually, when we start debugging, we only check the point where we notice the problem which means we have to verify each individual step that leads up to the point.
So the best practice is to start from the initial step and verify data at each level so we will know how data is passed on to next step.
Server Side Data
We said that we will take this process from the initial point. So our first step is to look for data on server side. Below are few things we can verify at server side:
- Data being rendered from the backend
- Generally, the data is already available by the time page is loaded
- We can inspect the page dom to see if it is available
- In most cases, developers implement this and we only see what is rendered
- Common issues that occur due to server-side data
- Formatting, showing up as string
- Have unnecessary formats(unescaped special character, currency code etc)
- Time when the data becomes available (on page load, dom ready etc) vs when the tool is expecting data
- Best way to debug:
- View-source
- Console.log
- alert();
When to use?
Server-side data is checked when the data is not available after the page is being loaded or the data you see is not in the proper format you expect it to be.
Browser / Mobile App
Browser is the most common place to debug and likely where most errors occur. A lot of variety on how data may behave based on browser or device factor. Browser is in the middle of server-side data and everything that comes after it.
Most of the errors that occur are browser based. There are multiple types of browsers including mobile and desktop version. So testing on multiple browsers is a little time-consuming.
The common issues that arise on the browser are:
- Browser compatibility with code
- Most of the errors exist in your code
Best ways to debug
- View-source
- Console
- Tool-specific extensions
- Network request (shows everything that happens in the bowser)
- Debugger
View-Source
This is the place where you can see the actual code. You can see the data source to view the actual code placement. For instance, whenever you have any confusions about the tracking code placement, right click on the website and select view-source.
Press Ctrl/Command+ F and search for ‘UA-’, to see where the analytics tracking code is placed on the website. Besides this, you can also look for ecommerce tracking and datalayer codes using the view-source method.
Console
Console is the best tool you can use to test your JS & jQuery codes. Before adding the codes in GTM or Analytics, use console mode to test.
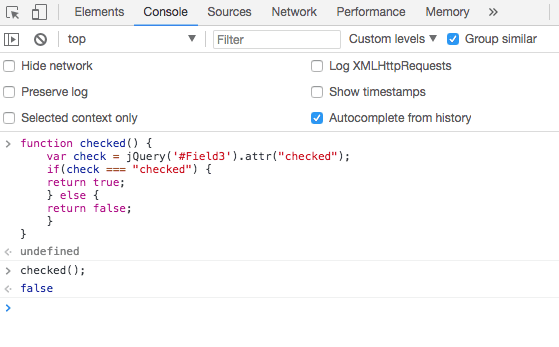
The console is also used for debugging with GA debugger and the datalayer inspector plugin, which are the essential tools for your debugging process.
When to use?
You should use this when there are chances of code errors and issues with programming logic. You will be able to see the actual code behind the loaded page.
Tool Specific Extensions
There are multiple browser extensions available which make it easy to display data in the console. Below are some of the extensions that can help you with the debugging process.
Ability to see what data is being sent
- Google Analytics Debugger
- Google Tag Assistant
- Mixpanel Debugger
- Facebook Pixel Helper
These tool specific extensions are good for use because they have organized everything according to best practices and are easy to use.
However, these extensions generally check for best practises so if your site is custom built it may not correctly identify if the setup is correct. Debugging is done when there is something that these extensions don’t pick up or if you still suspect errors despite the extensions giving you an all clear.
When to use?
Tool-specific extensions are used for verifying correct tracking code installation and verifying the best practices.
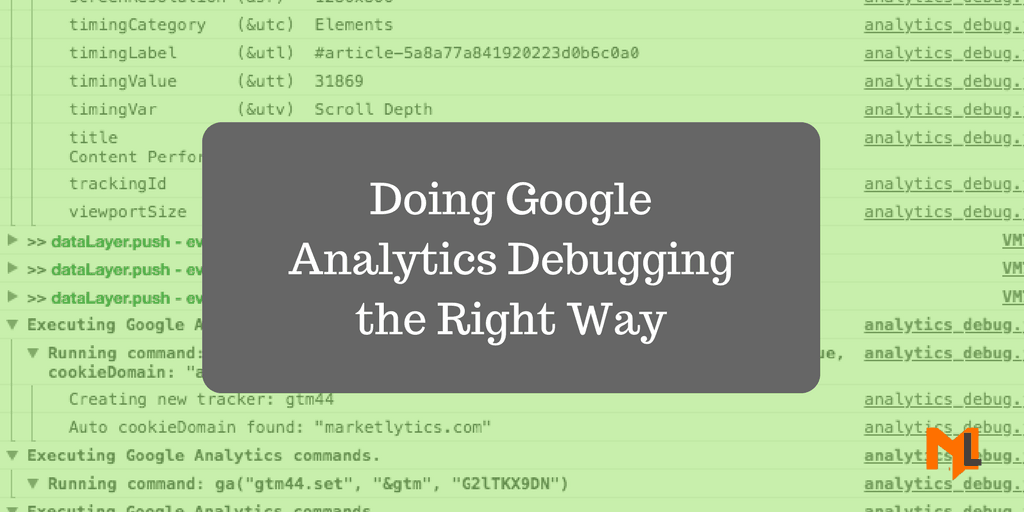
Network Requests
This is where you can see all the information that is being sent and received. It is known as the communication layer for all information being sent to a browser.
The cons for network request is that when the page renders, It gets data from other sources as well and not only analytics. It is necessary that you apply filters and you should know which filters to apply.
Whenever you are extracting something in network request, you should already know how to extract that particular data. Also to understand the tool, you should know what each parameter means.
For example, in the network tab if you search for google-analytics it would show requests that are being sent to that end-point and all parameters sent along with it.
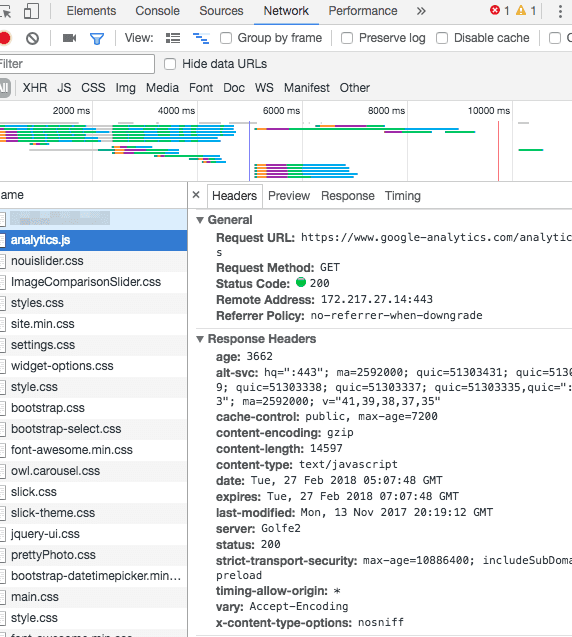
You can not always expect to see everything here, because in some case cases some data may be hashed and not easily readable.
When to use?
Network request gives you all the data that is being sent and received so mostly useful for really diving deep to look at data in depth.
Debugger
The main power of debugger is that you can stop the code at the execution time and inspect to see which function is running and what data is passing at the moment.
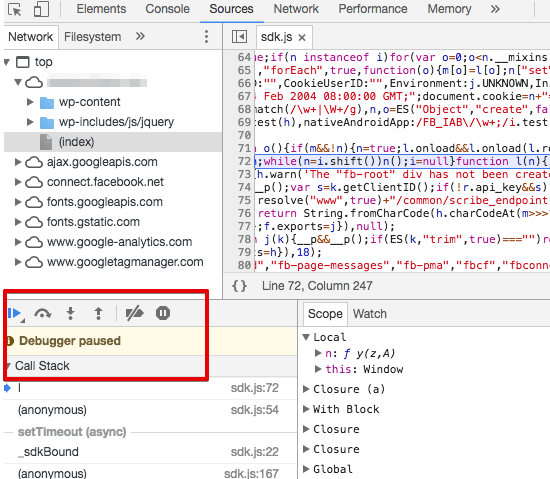
The benefit of using debugger is you can see the data being changed while it is executing. You can add breakpoints to stop the code at a certain point and see what data is actually passing at the moment.
When to use?
Using debugger is best for folks with technical background and understanding of javascript.
PS: These are the sort of problems where a lot of folks may reach out to us for support.
Tag Management Platform
There are multiple tools counted in data management platform which are Google Tag Manager, Tealium, and Segment. There are actually the tools where you can observe and test your data.
For example, preview mode in tag manager helps in testing if your implementation is correct and the right data is passing or not. Similarly, you can use the debugger in Segment for testing purposes.
When to use?
This is optional and should be only used when you are using any of the tag management tool.
Analytics Tool
This is the final place where all the data is being recorded. The data is generally processed before it is displayed in the analytics tool. If you find any data issue at this point, you will have to go back to previous steps, that is why it is recommended to start debugging from the beginning.
This is generally good for seeing patterns on narrowing cause of a certain error. For instance, we can use dimensions that allows us to segment data. Also, we can cross-check data with other platforms like ecommerce orders, sign-ups..etc.
In most cases, there isn’t any actual cause of errors unless you didn’t configure the account correctly. The common configuration errors include time zones, filters, account linking, referral exclusion,..etc.
Over to You
These are the few ways you can use for analytics debugging to make sure the data is accurate. What’s an interesting debugging challenge you faced recently and how did you catch it? Share in comments. 🙂