
Analytics has pretty much become a multipurpose gaming arena, catering to both, the marketing side of things, as well as the product. See what happens is, when you launch a product, you always want to track the traffic. Here’s where things get a little jazzy though. Most SaaS founders, after launching their product can’t really put a finger on when to start tracking.
In this article, we’ll be slicing and dicing our way around using Amplitude to measure your SaaS product and how to go about installing it with Google Tag Manager.
An Introduction to Amplitude
So what is Amplitude?
Fantastic question, I thought you’d never ask! Amplitude is an advanced analytics tool that was launched in 2014 to help product managers rapidly drive business growth. Makes sense so far? We call it an ‘Advanced’ analytics tool because it can identify who the user is, enabling you to tie the user behavior to the point from where the user first landed on your site.
Another thing, is that Amplitude is an event centric tool which accepts everything as actions instead of the traditional pageviews. So in case you want to, let’s say, track a pageview, you will have to record it as an event.
That being said, let’s head on over to the pricing plan. Amplitude comes with a free starter plan, where you can track upto 2 million events per month with access to core analytics and unlimited user retention. Amazing right? Other plans include Elite and Enterprise, where the event volume is at least 10 Million and the specifications are outlined in the customer contract.
There are of course, many other advanced analytics tools available that can be used for SaaS products, but for the most part, Amplitude has, and probably will remain our personal favourite in terms of it being incredibly powerful in tying anonymous user activity with that of the known user.
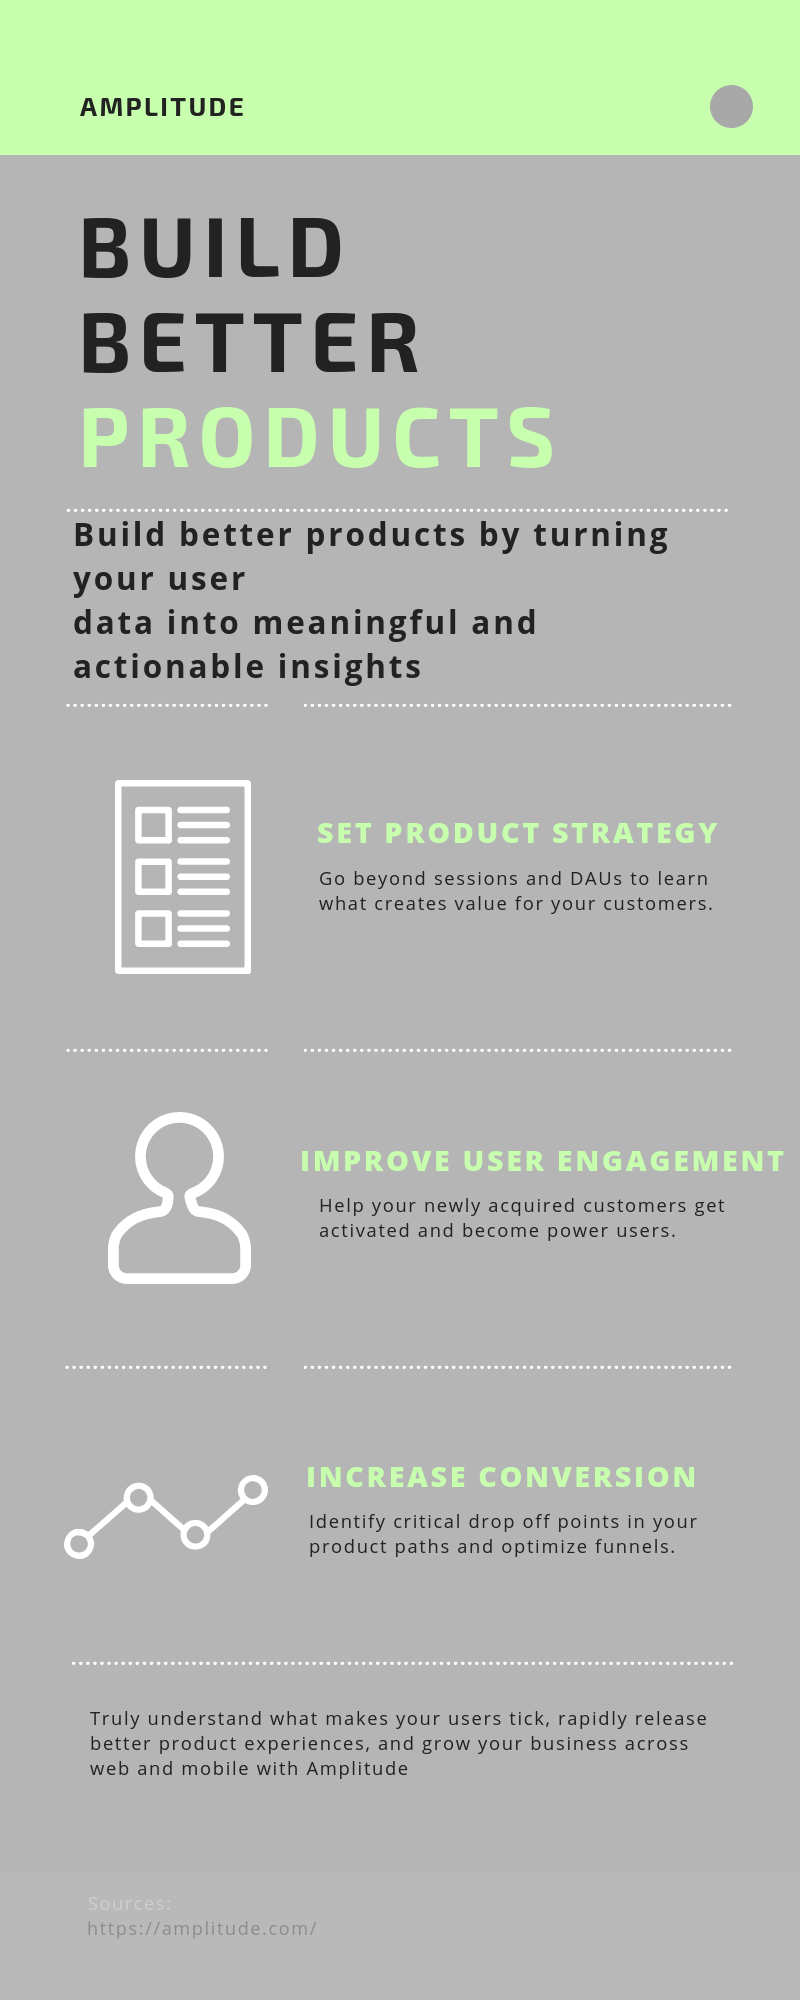
Here’s a nifty summary of what Amplitude can do for you.
Do I really need Amplitude?
Well. Depends.
Let me explain. It takes time for a product to mature into a generous revenue producing commodity. Sometimes new start ups and freshly launched products looking to track user behavior have users ranging between 100 – 1000 per week.
At this point, it’s best to focus on acquiring a larger user base and audience. If you really really want to track traffic, consider going ahead with Google Analytics! You can also try Hotjar for heatmaps, visitor recordings and polls to know what users do on your site.
However, once you hit around the neighborhood of 5000 or so website visitors milestone, here’s a personal thumbs-up for being good to proceed with Amplitude to track user behavior, user retention and performance of each feature.
Business Objectives – A little Prerequisite
Before implementing Amplitude, I’d highly recommend (and so will everyone else in the industry!) that you have a clear and well thought-out set of business objectives and Key Performance Indicators (KPIs) ready. This is will help immensely in sending the right data to Amplitude and measuring performance.
Here are a few examples of good KPIs for a SaaS Business.
Churn Rate
Monthly Recurring Revenue
Customer Acquisition Cost
Customer Lifetime Value
Click here to learn more about SaaS KPIs.
Finally Getting Started with Amplitude
Yes, finally! Let’s get started shall we?
To start tracking your app performance with Amplitude, you need to first sign up for an Amplitude account. Once you’re done with that, go ahead and create an Organization. An Organization, by the way, is your company or team account. With me so far?
Here’s a little what it should look like when you’re filling out the blanks.

Now, within the organization, you can create multiple projects. Amplitude recommends that you create AT LEAST two projects for your app, where one will be used for testing and the other is supposed to analyze data.
One thing to note here, is that even though different projects can exist within the same organization, they act completely independent of each other and cannot be used for cross data sharing. Each project has its very own API key and tracking code that you will need to add to your app if you want to track data.
Installing Amplitude with GTM – Hooking em up!
Before you jump to conclusions, you still need to install Amplitude library on all pages of your app/website before you can get anywhere near starting to track actions. For the sake of this article, I’m going to go ahead and use Google Tag Manager for installing Amplitude. I suggest you do the same!
Follow the steps below to the T and you should be good!
1. Load the Amplitude Library
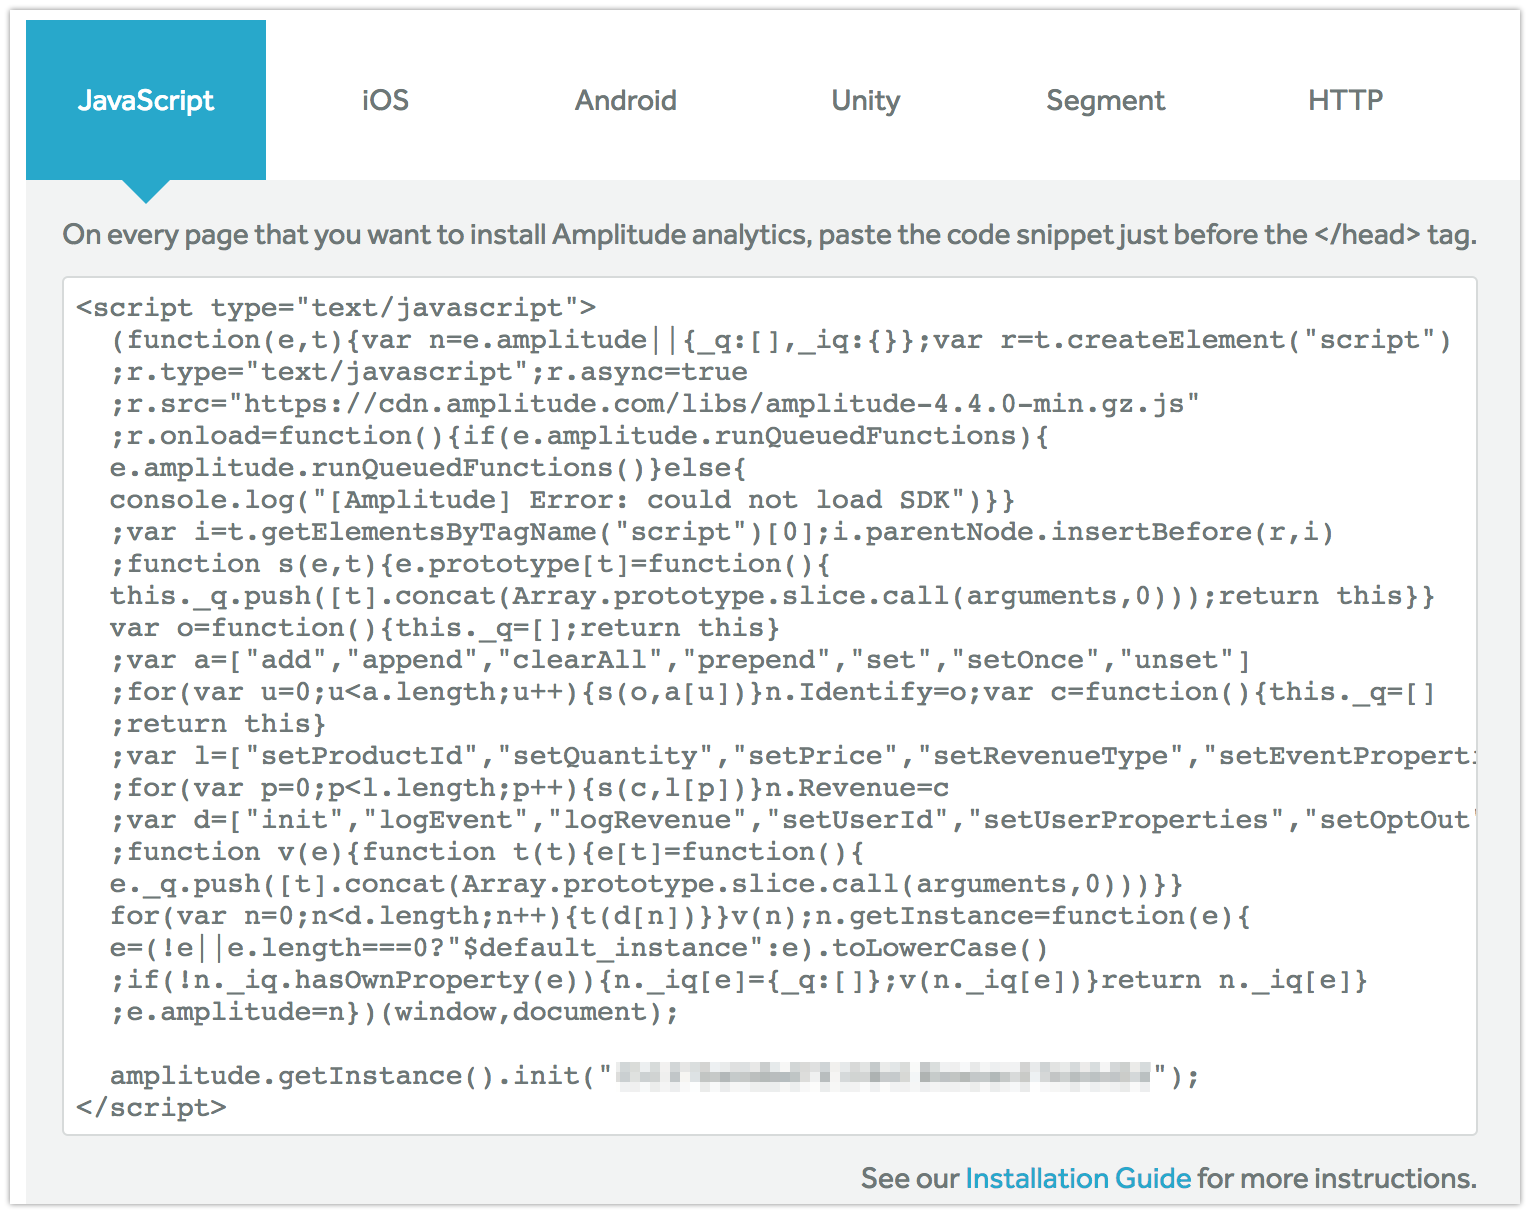
Now, if you’ve been following along correctly, you should have received a tracing code on creating a project in your organization. Yup, copy that, we are going to have to install in into the website.
Below, is how it should look like.
Next, follow along the steps below,
1. Create a new tag in Google Tag Manager
2. Name the tag as ‘AMP Library – All Pages’
3. Select the tag type as ‘Custom HTML’
4. Paste the above code inside the custom HTML container
5. Select the all pages trigger
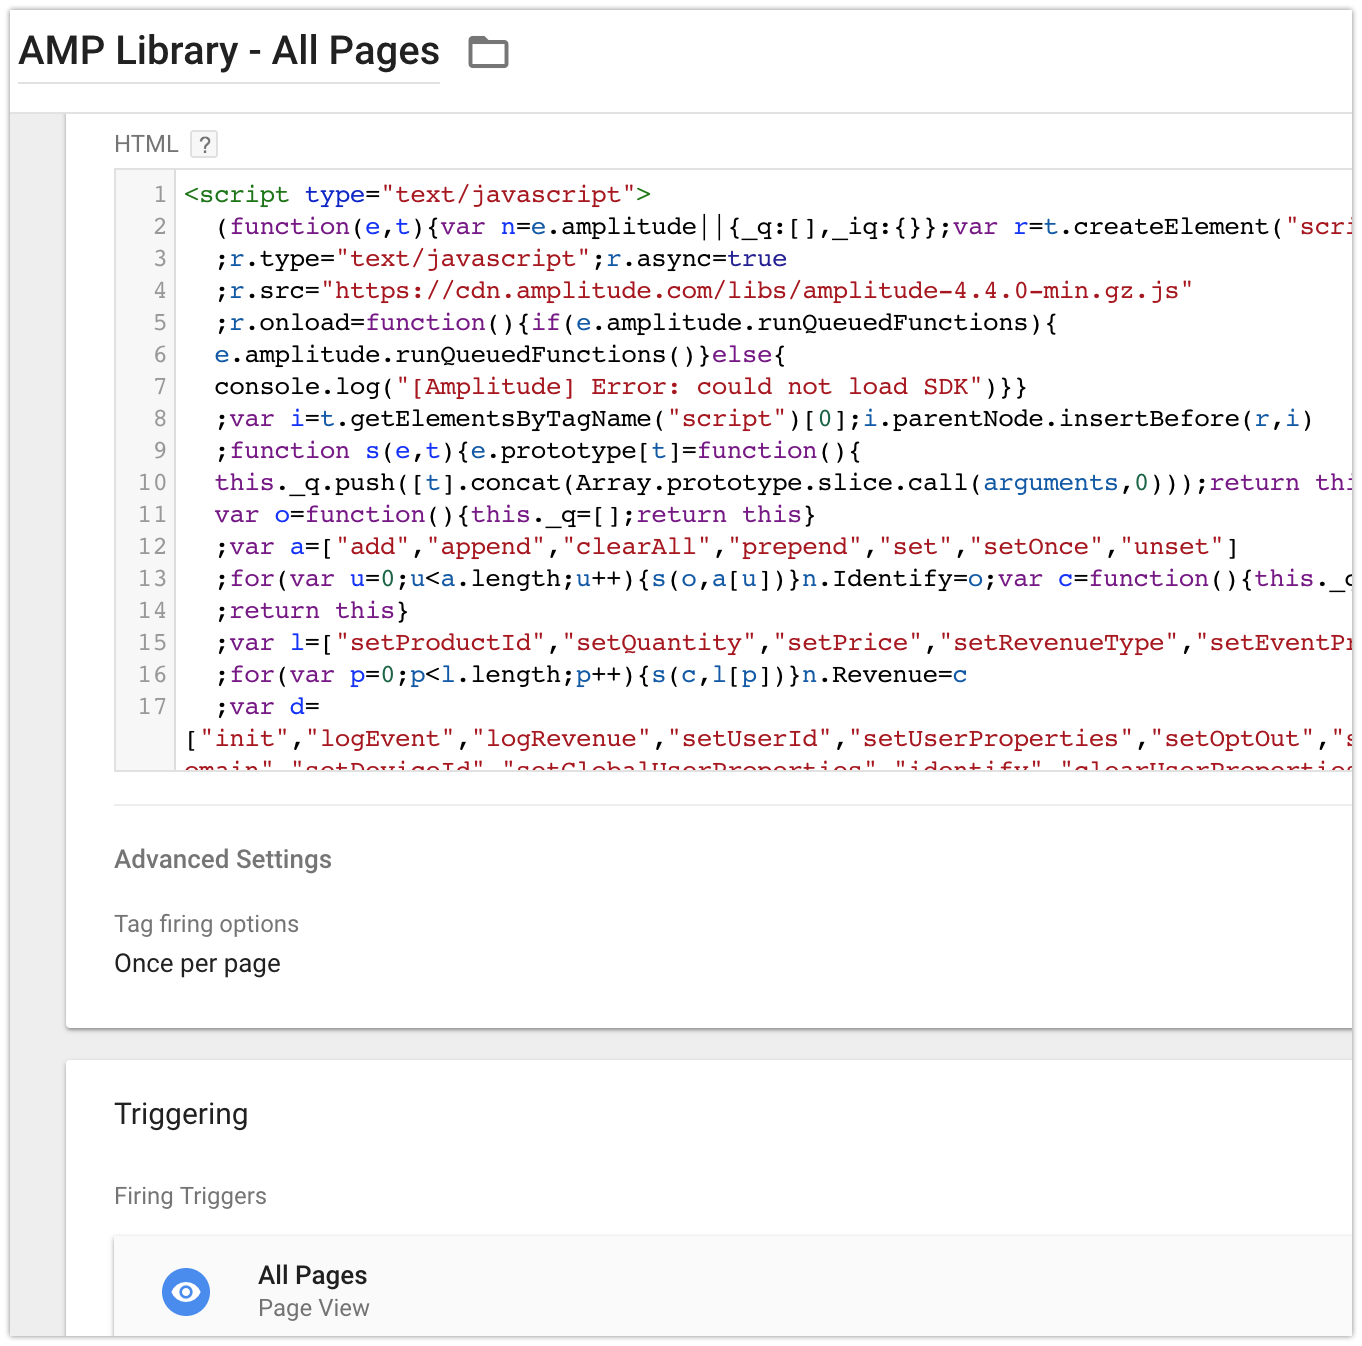
Save the tag, and you’re done, for now.
The purpose of this tag is to load the Amplitude library on all pages. However, this will not send any data to Amplitude. To start sending data we will have to set up our first event. To see how data flows to Amplitude, let’s create a new tag to send pageviews as events to Amplitude.
I hope you’re following along though, if at any moment you feel the need to stop and go back up a couple pages, by all means do so.
If you don’t, well all the better for me, let’s move on.
2. Create your first event: Record Pageviews
To send the pageview event, follow the steps below:
1. Create a new tag
2. Name the tag as ‘AMP Event – Pageview’
3. Select the tag type as ‘Custom HTML’
4. Paste the below code within the HTML field
5. Click advanced settings >> Tag Sequencing >> Fire a Tag before – AMP Event – Pageview fires
6. Select the AMP LIbrary tag to fire before the event tag (This should be done for the tags you setup for Amplitude).
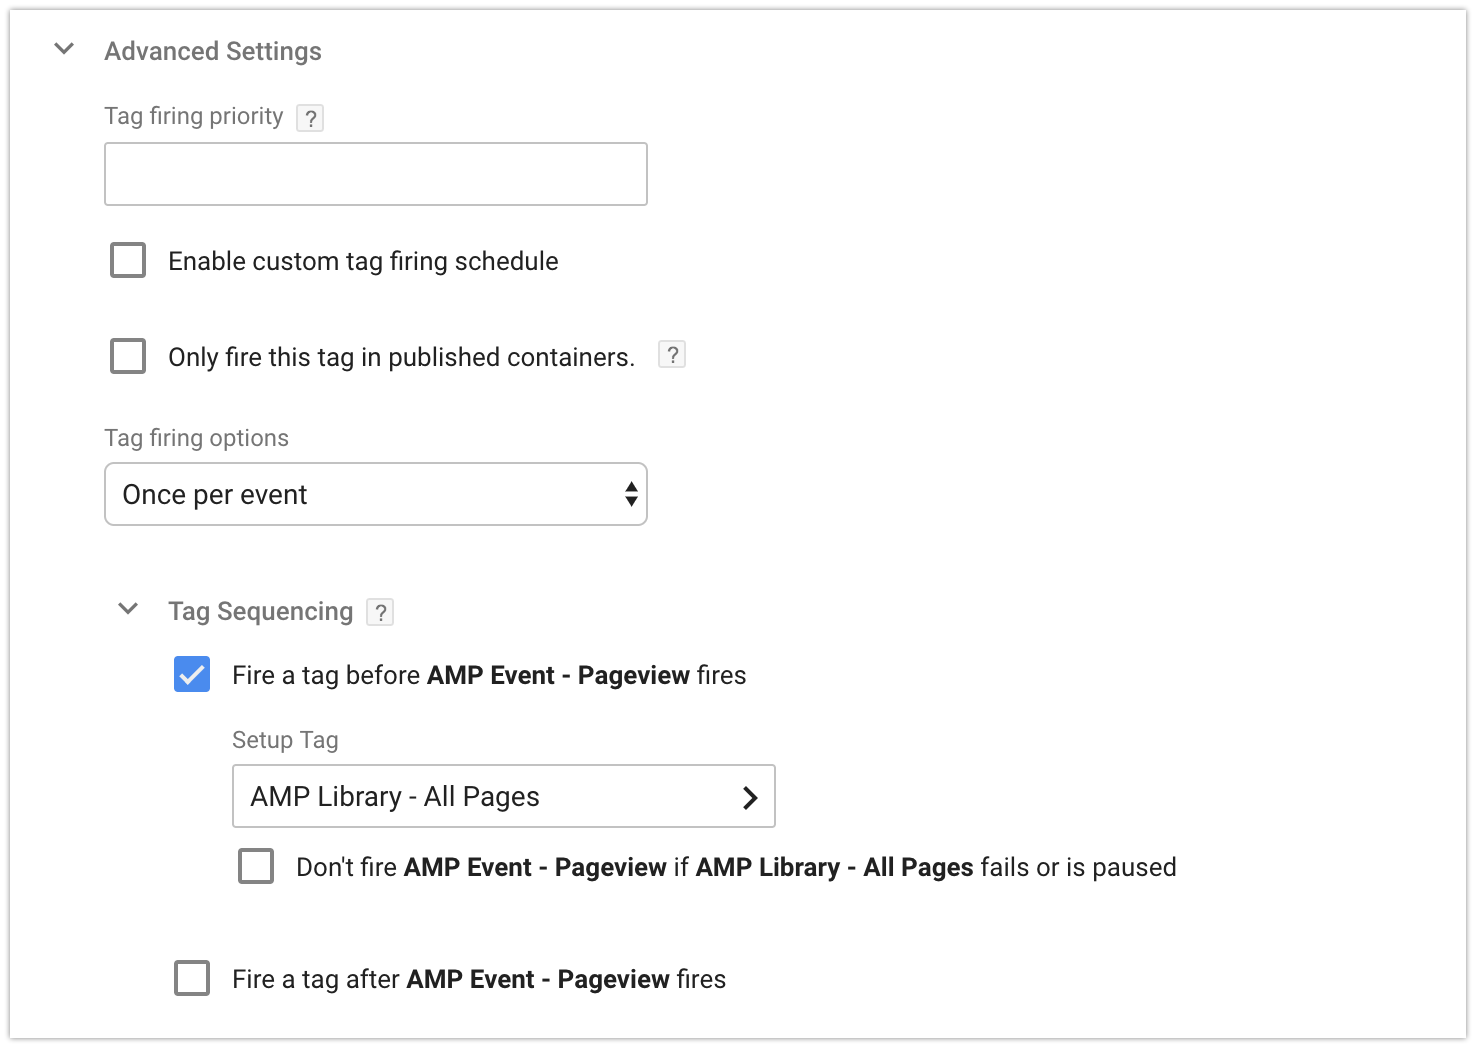
7. Select the tag to fire on all pages.
8. Save the tag. Initiate preview mode and open your website in a new tab.
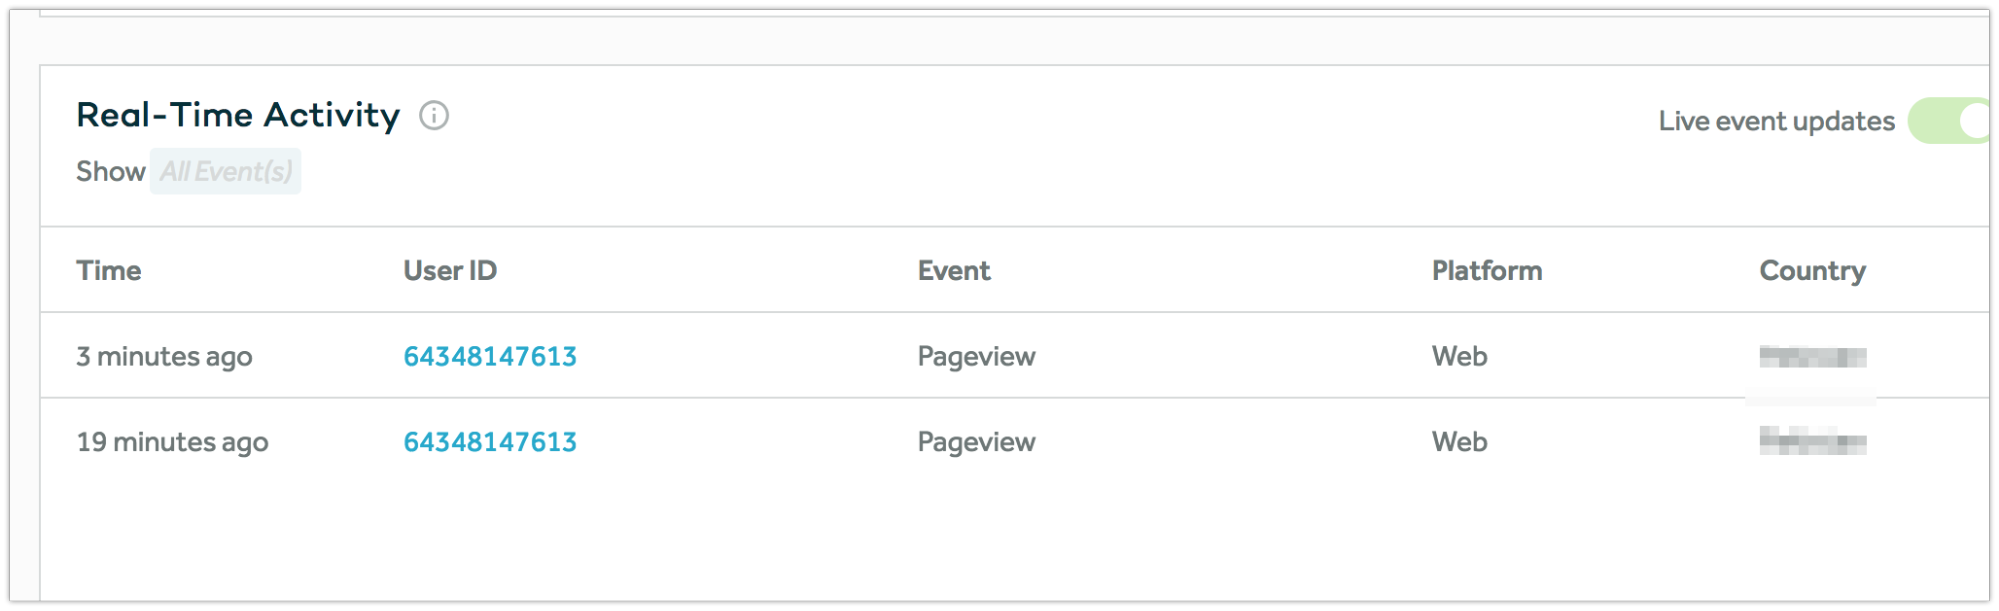
Now go to your amplitude dashboard.

If your dashboard is empty when you open it, don’t freak out! You’ve done it right. However, you should be able to see the data in real time. To do so, select user activity from the top of the navigation menu.
Now, within this dashboard you can create different types of reports consisting of charts, graphs and bars.
You can also send multiple events to Amplitude, similar to the pageview event. What’s more interesting is that each event also has its own set of event properties. These are properties of a particular event and reflect the state at which it was triggered. For an event like a pageview, the event property would be page path.
Quite similarly, you can track users as well, and like even properties, these also come with user properties.
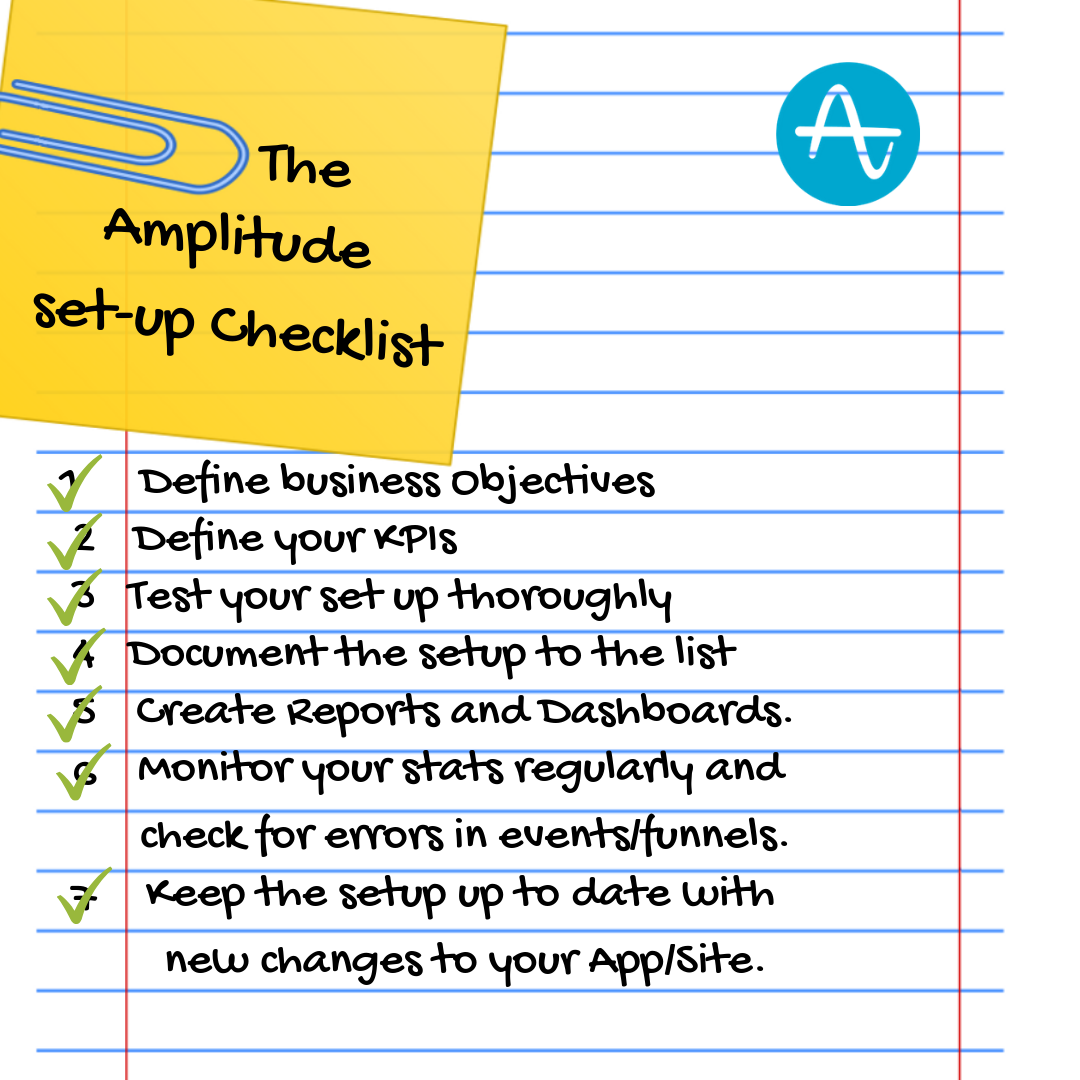
Tracking users and an in depth explanation of user properties however, is however to be covered in future articles, along with a template to easily integrate Amplitude. For now however, here’s a checklist to follow when setting up Amplitude.
Final Thoughts
By now, if i’ve done my job well, you should be able to understand why an advanced analytics tool is an absolute necessity for your business KPIs to meet your end goals. I say this because during the past few years, we’ve helped quite a number of startups improve their products and marketing campaigns using Amplitude.
If you aren’t able to decide however if Amplitude would be a good fit for your app, or if you’re facing issues installing it, hit us up! We’d love to help!