Revenue attribution would be the easiest task if a lead would just click on the ad and convert immediately afterward. In such perfect scenario, you wouldn’t have to bother yourself with revenue attribution models.
But that is not the case quite often.
What usually happens is that they visit multiple channels/touchpoints in the journey before converting. So the real question is – how to know which marketing channels deserve the most credit?
It depends from case to case. That’s why we have various revenue attribution models so that you can calculate the value of a particular channel based on your company’s campaign preferences.
There are two big groups of revenue attribution models – single-touch and multi-touch.
Single-touch models
We only consider one part of the journey in single-touch models – the latest or first part. In other words, these models are either first-touch or last-touch.
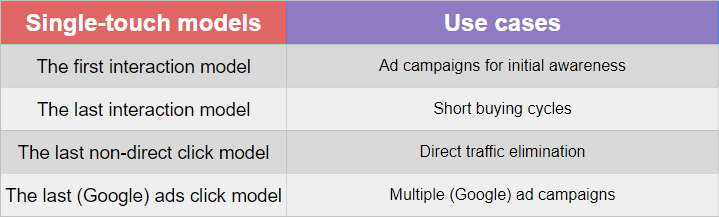
The first interaction model
The first interaction model gives 100% of the credit to the first touchpoint between conversion and your website/business.
Let’s say your lead found you on Facebook. Then they signed up for a newsletter and converted after that. In this case, Facebook gets the full credit.
Use case: If you’re running ad campaigns for initial awareness, especially if your brand is in the early stage, this model might be helpful to you.
The last interaction model
This model is (obviously) the opposite of the previous one. It gives 100% of the credit to the last touchpoint the lead interacted with before converting.
In the previous example, the lead clicked on the Facebook ad, signed up for the newsletter, and converted afterward. But this time, we give full credit to the newsletter.
Use case: The last interaction model is great for short buying cycles without consideration phases. If there are not too many touchpoints before converting, this might be the best model for you.
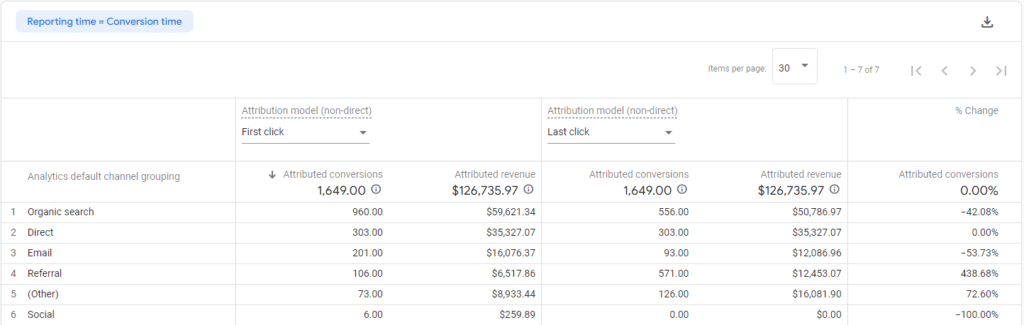
Here is the example comparison between the first and last interaction models in GA:
The last non-direct click model
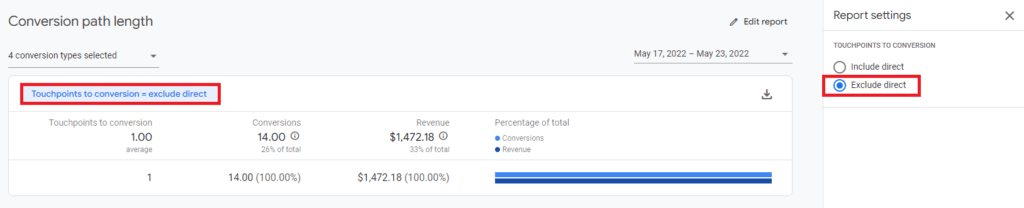
This is a default model used in non-Multi-Channel Funnel reports in GA, and, in most cases, it provides more value than the previous model. It ignores all direct sessions and gives full credit to the last channel the lead clicked through before converting.
Even though this model also ignores all touchpoints before the last one, it’s still excellent for exploring channels that give you the most conversions. In addition, the fact that it eliminates direct clicks helps you get better insights.
Use case: Eliminating direct traffic is suitable when you know it comes from conversions you already won on other channels. In that case, filter out direct sessions and highlight the last activity before conversion.
The last Google ads click model (or other marketing channel)
The name says it all – this model attributes 100% of the conversion value to the most recent Google ad a lead clicked on before becoming a conversion. However, you can apply the model to other social marketing channels, e.g., Facebook or Instagram.
Use case: If you’re running multiple ads, this model can be helpful to you in understanding which one closes the most conversions.
Multi-touch models
As the name implies, multi-touch means that you’re considering multiple channels or steps in the customer journey.
The linear model
It’s the simplest multi-touch model that evenly applies the credit to every channel/touchpoint on the conversion path.
For instance, if you have four sources (Facebook ad, Google ad, email newsletter, YouTube ad) that a person used before making a $100 purchase, a linear approach would be to divide these $100 into $25 credits to each source. So basically, your revenue attribution value for each would be $25.
Use case: This model is for you if you want to equally demonstrate each channel’s value in your marketing/sales cycle (especially during the consideration process).
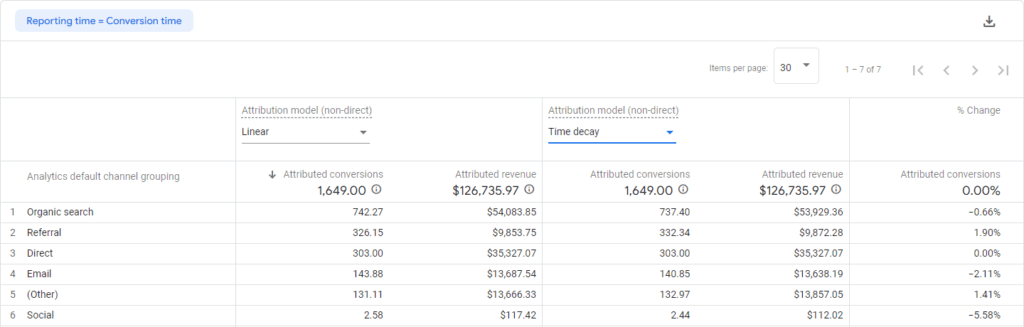
The time decay model
This model also credits each source in the customer journey, but there’s one big difference compared to the linear model. This time, you give more credit to the touchpoint closer to the purchase moment.
So, if a lead visited your site from a Facebook ad a month ago and then did the same thing by clicking a YouTube ad today before making a purchase, you will give more credit to YouTube since it’s much closer to the conversion.
Use case: This model is helpful in long sales cycles. For example, if you run promotion campaigns, you would want to give more credit to sources during the promotion days and less credit to interactions that happened a week ago.
Here’s the example comparison between the linear and time decay model in GA:
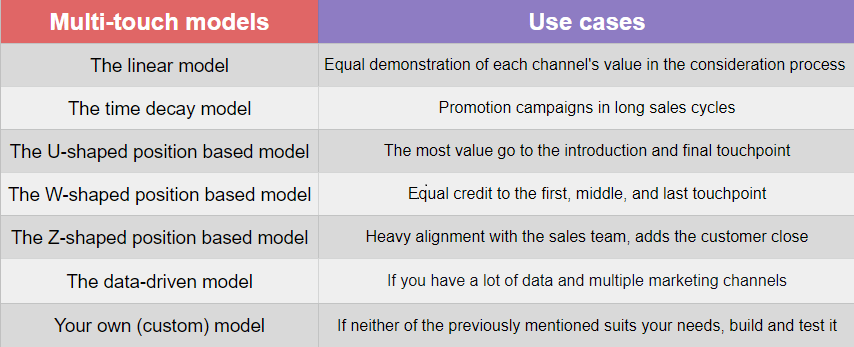
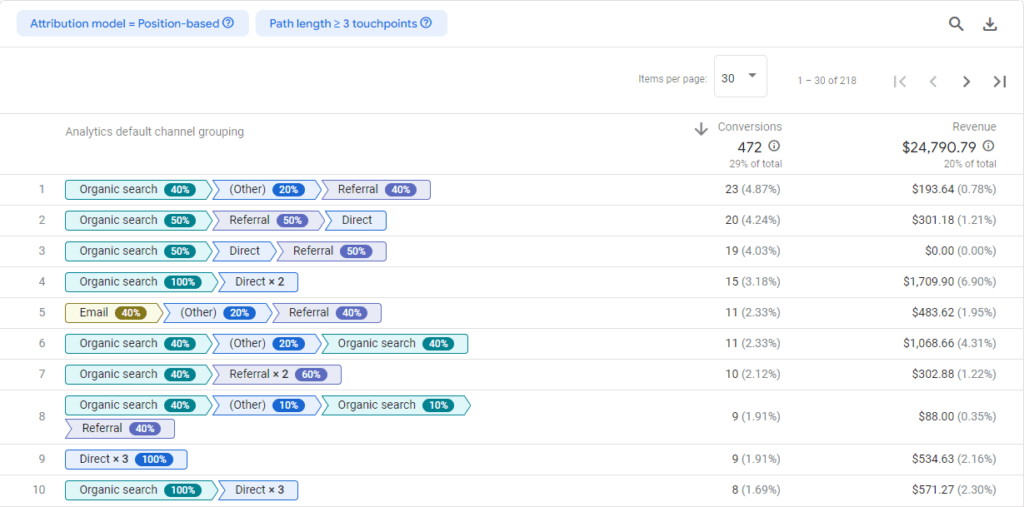
The position based model
You can also call it a composite model. It’s a hybrid of the last and first interaction models. In other words, you split the credit between these two touchpoints based on your own priorities.
Here are some of the examples we will explain in the following paragraphs:
There are three variations of this model:
1. U-shaped model
If someone came to your website from a branded campaign, they first had to be introduced to the brand itself. In this case, you can split the credit between the first and last source, but you can also give some credit to the sources in between.
For example, a lead clicked on a Google ad, then checked one of your social media channels, and finally signed up for a newsletter and converted from there. In this case, Google and newsletter, as the first and third touchpoint, get 40% of the credit, and the social media channel gets 20%.
Use case: If you prefer to give the most value to the introduction touchpoint and final touchpoint before the purchase, this model is suitable for your needs.
2. W-shaped model
Unlike the U-shaped model, W-shaped equally credits the first, middle, and last touchpoint in the customer journey.
Let’s use the previous example (Google ad→social media channel→newsletter). Instead of giving less credit to the social media channel, we give 30% to each touchpoint. Then, we split the remaining 10% between these three.
Use case: If you prefer not to give an advantage to any touchpoint in the customer journey, consider using the W-shaped model.
3. Z-shaped model
Now we’re coming to the most extensive model. Instead of splitting the credit to three touchpoints as we did in the previous example, we now have an additional one – the customer close.
So, this time, we split the 90% of the credit to four sources, so each gets 22,5%. The remaining 10% splits between these four sources.
Use case: If you rely on heavy alignment with your sales team, this could be the right fit for you since it’s the most extensive one.
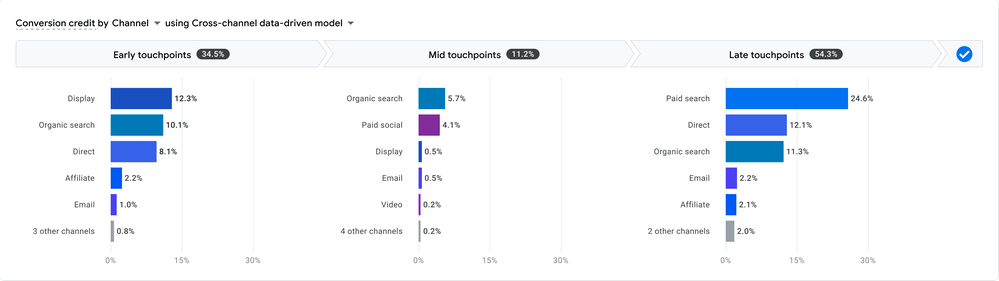
The data-driven model
In multi-touch, there’s an option to do more machine learning or vast statistical models. So one of the most famous is a data-driven model.
Google uses machine learning to figure out sources someone uses to buy, which of these are most important in that funnel, and give them more credit.
Use case: If you have a lot of data, for example, 30000 sales per year and more than six marketing channels, you can consider a data-driven model. Just let a computer give you that data and help you make better decisions.
Building your own (custom) model
More sophisticated marketers and companies build their own models. They use different criteria to determine what things are most important to them or their customers.
This is based again on data analytics, figuring out what sort of behavior stats of those customers are the most relevant, what drives these behaviors, and most importantly, figuring out the right model strategy based on all that.
Use case: If any of the above-mentioned multi-touch models don’t suit your company’s needs, don’t hesitate to build your own and test it.
What should be your first steps as a marketer to make the most use of revenue attribution models?
1. You should first compare your ad platforms’ conversions with conversions you have in GA to see how models in ad platforms and GA differ. Understand what the key differences are.
2. If you’re using GA, there’s a tool called model comparison tool that compares different models in GA, so you can use them to understand differences.
3. Certain channels get more credit based on the attribution model. Why does that happen? Explore these reasons to understand better the sources you need to focus on more.
4. Based on all that, you can start thinking about:
- How are you spending money?
- What are more critical sources?
- What is your company’s stage?
- Do you want to acquire a lot of new users or focus more on keeping existing users
After getting answers to these questions, create your attribution strategy.
5. Because there are so many channels you’re using, there’s no perfect attribution model – it’s always an experiment. So you have to keep comparing.
In case you need help, you can schedule a free strategy call with us with no hard strings attached.
Final verdict
Let’s quickly summarize the key takeaways regarding both single and multi-touch models.
- Single-touch models either credit first or last touchpoint. First-touch is more suitable for initial awareness, while last-touch models make more sense for short buying cycles.
- Multi-touch models apply the credit to each touchpoint in the journey. However, you can either split that credit evenly or give more priority to particular channels.
- Consider building your own model if neither of the “standard” models doesn’t suit your company’s needs.
- As a marketer, go through the five steps we mentioned in the previous chapter before choosing the right model strategy.