
About the Client:
Drink Cirkul is a startup striving to make the effort of staying hydrated a pleasant experience by providing enhanced and fully flavored water on-the-go all across the USA.
We worked with Drink Cirkul when they had just started out and wanted to set up Mixpanel on their website. In the past couple of months they have grown incredibly and wanted to use Mixpanel to maximum benefit in order to measure the user behavior more accurately and track the conversion funnel.
We worked with them again after almost a year, starting with a Mixpanel audit, moving on to fixing the existing issues and finally, measuring the conversion funnel accurately.
The Challenges:
Drink Cirkul offers a two week free trial to their customers and the billing starts automatically after the trial period ends. Unless of course, the user cancels the trial at some point, or, the customer fails to pay the charges.
Now, based on the services they offer, Drink Cirkul was looking for solutions to the following issues.
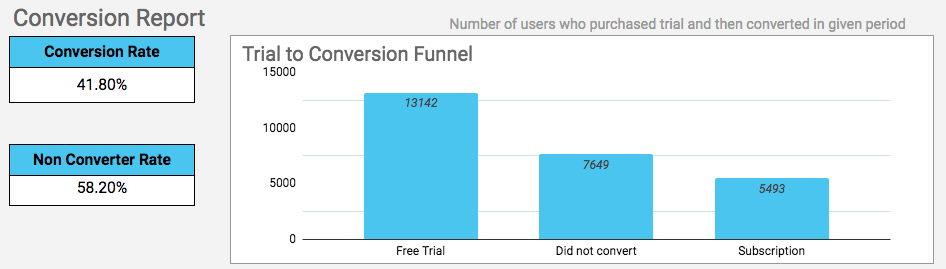
They wanted to be able to track the conversion rate from the free trial to subscription for any period of time.
-
They wanted to be able to track the churn rate, at any given period.
-
They wanted to categorize their customers into the following groups.
-
Number of people who completed the trial
-
Number of people converted
-
Number of people who cancelled subscription
-
Number of people whose subscription failed
Our Solution:
Since we had already installed Mixpanel on their site using The Google Tag Manager when we first worked with them, the ecommerce tracking was up and running. The real issue, was to help them track the conversion funnel, churn rate and the status of user.
Custom Conversion Dashboard using Google Sheet and Mixpanel JQL.
Mixpanel provides a powerful reporting feature but the client requirement was to see where the users are standing in terms of trials and subscription on a weekly basis. This was necessary since their business model demanded a granular display of data.
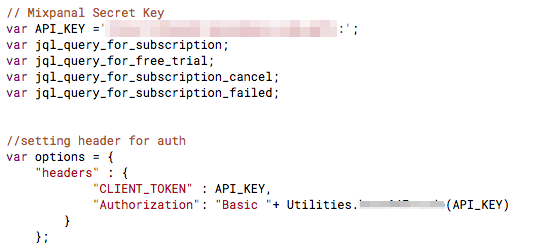
The first step in our journey, was to pull the data from Mixpanel in real time. Luckily, Mixpanel features it’s very own data query language, JQL, which really comes in handy when you want to pull out raw data or run complex queries for advanced analysis.
In order to help Drink Cirkul get a complete view of their client status, our team realized that a platform that could efficiently handle data as well as, allow interactive reports to be designed, was crucial. Since JQL and Google Apps Script both use JavaScript, the result, we concluded, would be a nice match for both carrying out the implementation, and displaying the results.
Finally, we not only had to show how their business is performing in terms of user conversion, but, we also had to create useful funnels. This required complex calculations, using dates, such as the user status in any week of a given period, or the time taken to complete the funnel after buying into the trial period and similar values. All of these required a lot of calculations and proper code structures so that the process doesn’t break. These, however, are separate from the real time calculations.
Results:
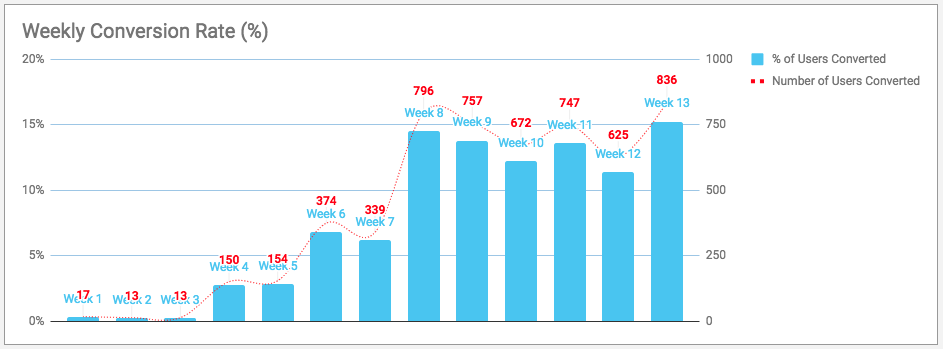
After capturing all the required data in Mixpanel, we needed to create an easy to understand report that would help the client monitor the stats. To achieve this goal, we decided to create a report in Google Sheets. For that purpose, we wrote all the JQL code to import data from Mixpanel. The results we achieved were great, and super useful for our client.
Below you can see the number of users converted on a weekly basis.
Not just this but we displayed all the information that Drink Cirkul required in order to improve the conversion funnel and make the marketing decisions.