In the first chapter of Google Analytics for SaaS, we discussed integrating Google Analytics on subscription businesses like SaaS applications and promised to provide you with some reporting tips.
“When it comes to reporting, we will have to make our data more organized and meaningful to better analyze our customer behavior.”
Keeping our word, here are some meaningful and extensive ways of reporting for your SaaS application. As we discussed in the previous chapter that setting up Google Analytics for SaaS is a bit different than that for ecommerce sites.
When analyzing your application traffic in Google Analytics, you have to assess all attributes from a different perspective. You have to think about guest users and paid users separately and monitor how they behave and interact with your app.
Understanding user behavior on your SaaS application can greatly contribute in enhancing the overall user experience of your app, and hence its usability.
Let’s move on to your beloved Google Analytics tool and see how we can slice and dice your visitors and customers.
Using Segmentation to Analyze User Behavior
If you you have been following our blogs, you might remember our last piece in which we discussed about creating multiple views for your SaaS app. We initially created three views; all website data, logged in users and landing page visitors.
When it comes to reporting, we will have to make our data more organized and meaningful to better analyze our customer behavior. To do this, we will be building segments in Google Analytics.
Segments allow us to isolate and group users having similar characteristics and helps us evaluate how differently they behave than the rest of the users. Furthermore, we can make multiple segments of users and compare the performance and features they use.
For any SaaS product, creating an account is the basic step every user has to go through. The logged in user view, will contain traffic data for all users including those using the free and those using the paid features.
We will now use segments to isolate all the logged in users into free and paid user categories.
If you are new to Google Analytics segments, there is no need to worry because GA has a couple of pre-built segments to get you started.
The all users segment is enabled by default in all reports. You can click a segment to enable or disable any pre-built one.
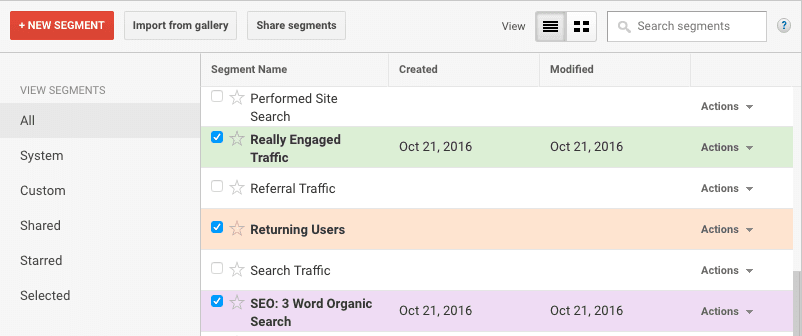
But these are the very basics, we need to uplift a little bit to efficiently segment our SaaS product visitors.
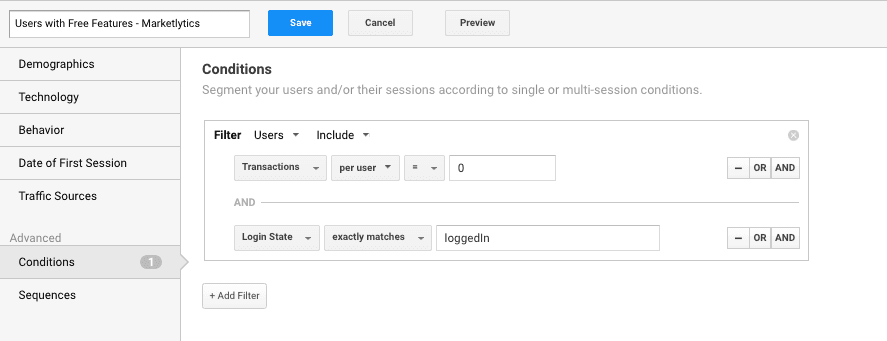
Users Using Free Features
As a SaaS business, you may have a large number of free users. You would always be in the quest of driving those free hanging fruits into your basket.
Separating unpaid visitors will allow you to:
- Figure out which free features they frequently use
- Monitor the bounce rate
- Trace their navigational route; that is after using your platform’s features. You can tell if they left your website or navigated to check your paid features
Below is how your unpaid visitors segment should look like:
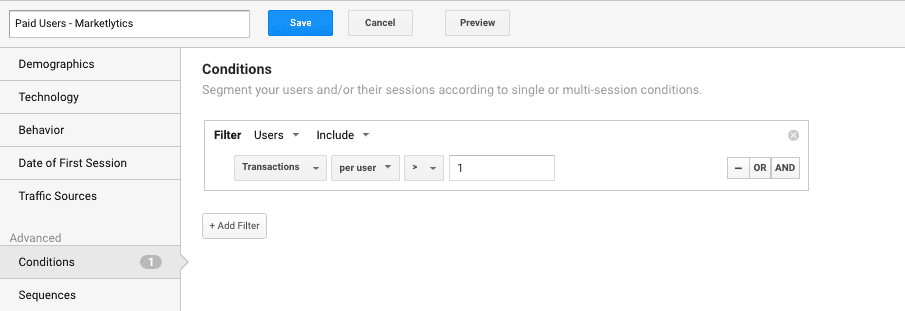
Users Using Paid Features
You would not like any of your customers to stop subscribing to your product. So, the best way to develop a long term B2C relationship, is to track behavior of paid customers.
You’d have to separate them from all website visitors and determine how frequently they are using your site’s features, which ones they use and if they are able to meet their end goals.
Below is how your paid customers segment should look like:
Using Custom Dimensions to Build Segments
You can also use custom dimensions to build segments in Google Analytics. For instance, if you want to check the number of logged out users, landing on your app via Google search, you can use the login state custom dimension.
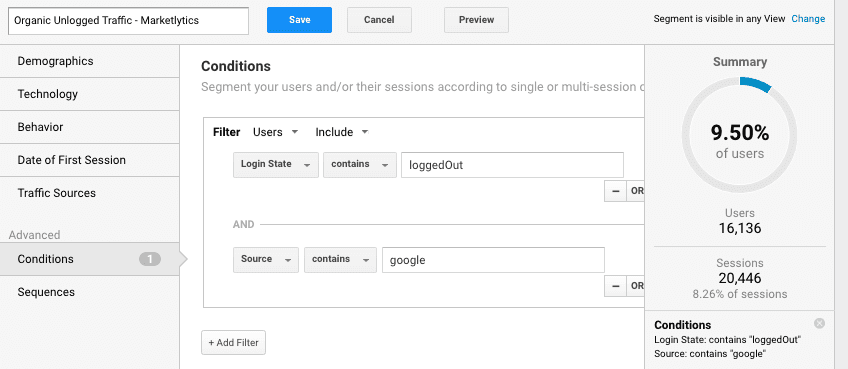
You can further play around with basic and advanced segments to better divide your users and understand their behavior separately.
Custom Dimensions for SaaS Product Reporting
We also discussed about using custom dimensions to capture valuable data that Google Analytics can’t tracks automatically. For your SaaS business product, you can use custom dimensions to record which plan a user has subscribed to.
Another dimension that can be helpful in this case, is to record the exact timeline of subscription. That is, the specific month or year when a user subscribed, and based on this data we will analyze their behavior from time to time.
In Google Analytics, there are basically two ways to report custom dimensions. By using the standard reports or with custom reports.
I. Adding Secondary Dimension to Standard Reports
The easiest way to report custom dimensions in Google Analytics, is by adding a secondary dimension to any standard report. You can do this by opening a standard report and clicking the secondary dimension drop down menu above the data table.
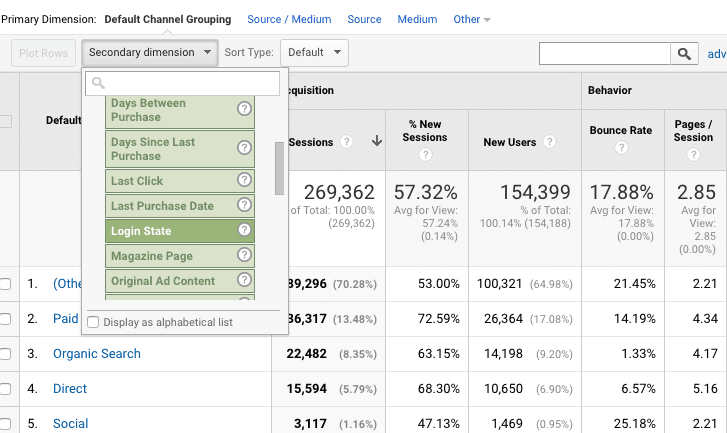
Choose the appropriate custom dimension from the list to display reports in the data table.
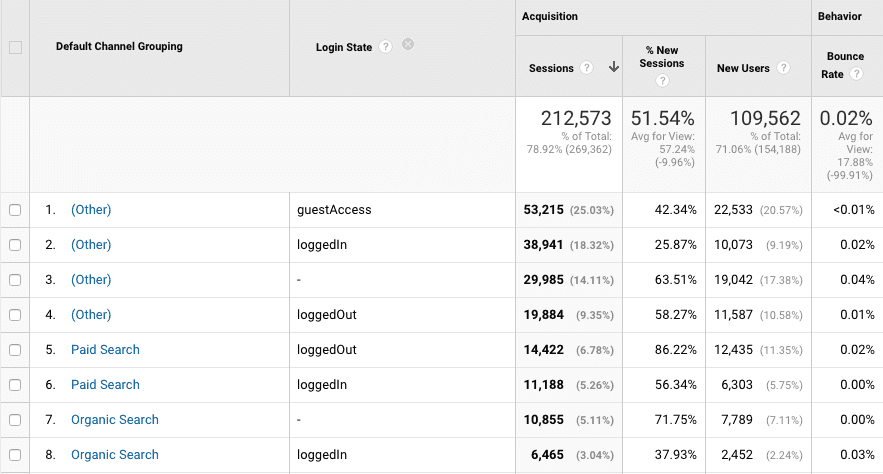
Note the new users column in this report to check the state with large number of new users.
II. Using Custom Reports to Display Custom Dimensions
The second method to display custom dimension reports is via custom reports feature. They allow you to visualize reports for multiple custom dimensions within the same table. You can choose the custom dimension to be your primary dimension.
Here, we will use custom reports to view the login state for all the pageviews that happened across our app.
To set up custom reports, follow the steps below
1). Click Customization from the left menu and choose custom reports.
2). Click on the New custom report button.
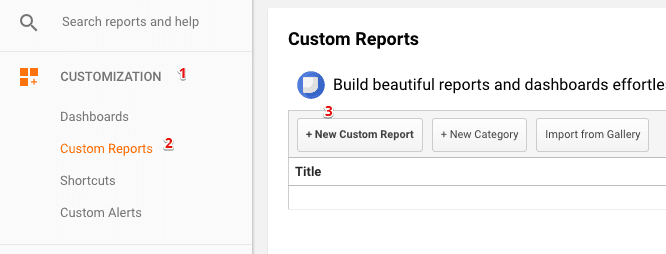
3). Configure the custom report as shown below
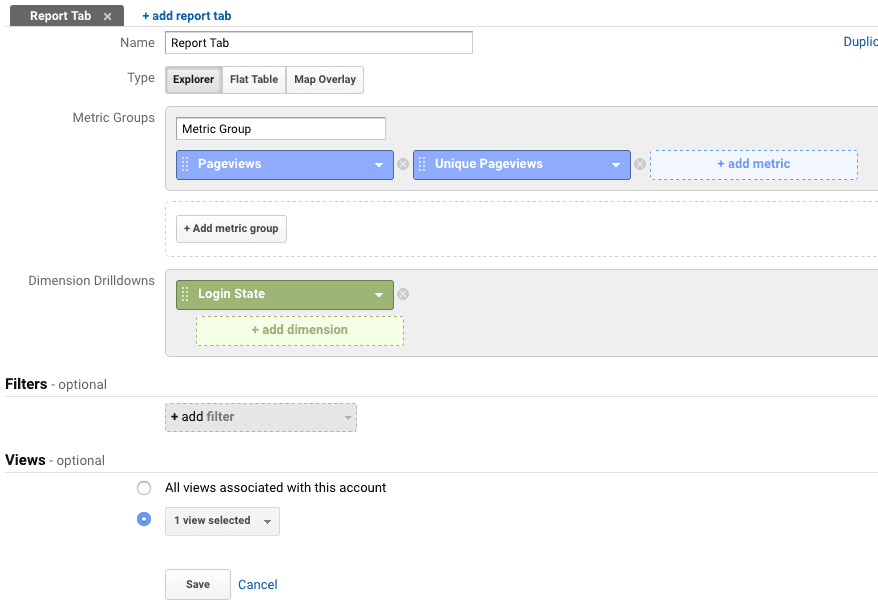
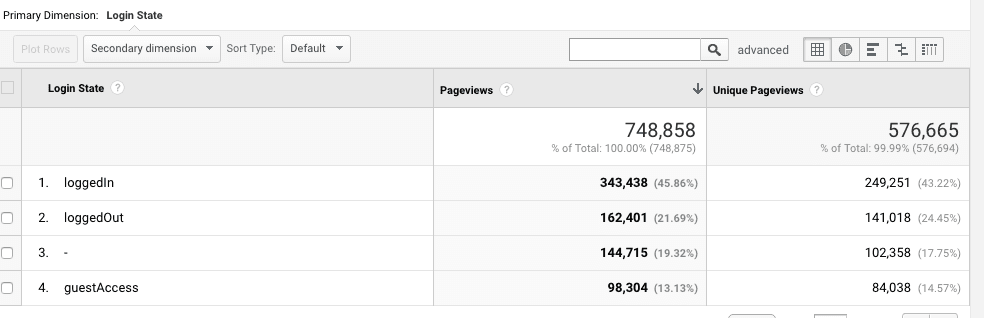
We choose pageviews and unique pageviews as metrics that were available by default in GA and selected Login State as the custom dimension. Next we selected the view in which we want to display the reports in and clicked save.
The custom reports would look something like
Using custom dimensions you can answer the following types of questions related to your data
- Which group of users – categorized by plan, are most active on your site?
- What are your apps most used features?
- What percentage of users are re-subscribing to your features?
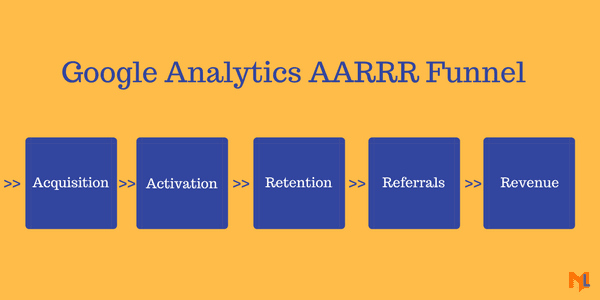
Using Goals to set up AARRR Model
When we talk about SaaS startups, it is impossible to leave out Dave McClure’s startup metrics. AARRR is a fantastic model to understand your customers and hence better understand funnelling and optimize it for better outcomes.
Google Analytics is the best tool to create a funnel based on the AARRR model.
Continuing the goals setup we discussed in the previous chapter, we can actually create a funnel to see how customers behave and convert.
Acquisition
The number of user you acquire. This refers to number of sign ups for your SaaS product. This would be a google analytics goal.
Activation
The number of users using your product.
Retention
The users actively using your product. An indication of how satisfied a user is with your product.
Referrals
If users are satisfied with your app’s services, they will spread the word and refer it to their friends. You can track referrals in Google Analytics.
Revenue
The number of users converting. Those are the happy users!
As we discussed in the freemium model, you may acquire a very large number of users at the acquisition step but very few of them move through the funnel and end up purchasing your product.
“The easiest way to get 1 million people paying is to get 1 billion people using.”
Using Goals to Check the most converting channels
Defining goals in Google Analytics doesn’t just display the conversions and actions completed. It also discloses the highest number of goal completions by each source and medium.
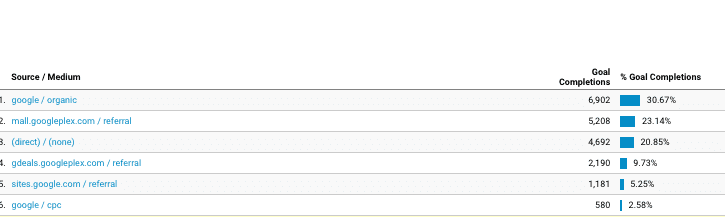
You can see this report by navigating to Conversions >> Goals >> Overview
This report can help you focus more on the channels that are driving more customers for your product.
Understand lifetime value or how valuable the user is
Customer Lifetime Value(LTV) is a prediction of net profit attributed to the entire future relationship with a customer. While considering the growth of your company, the most important metric to measure is LTV.
The increase in LTV means your customers are happy with your product and willing to pay more while a decreasing LTV might not be beneficial to your business. Now, the question – is how you are going to calculate LTV in google analytics?
Again you would be using custom dimensions and custom metrics to measure LTV in google analytics.
Understand all activity one user does
For a subscription based business, it’s more important to understand how each user interacts with your application. Some of the users might use your application on daily basis and some might be active at a given time.
When tracking the user activity on your application, it is also important to track any errors that a user faces. Frequent occurrence of errors can push them to abandon your platform completely. Let’s look into google analytics to see how you can track user activity and how frequently a user comes back to your application.
-User explorer reports
The user explorer report in google analytics, allows you to isolate and examine each individual user based on client id or user id. In this case we will need the user id to track individual users as we explained before.
Once you set up a user id, the user explorer(Audience>>User explorer) reports in google analytics will display reports based on user id instead of client id.
This report will display sessions, revenue and transactions of every individual user that has been assigned a user id.
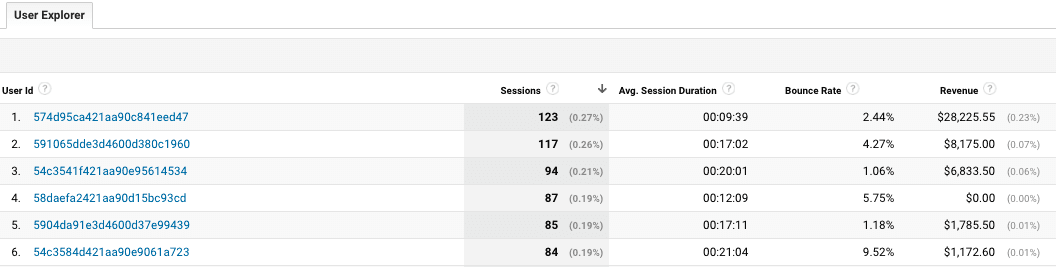
The benefit of using the user explorer report is that you can create a segment for users with similar actions and analyze their collective behavior.
-Tracking recurring revenue
A SaaS business is not like other software businesses where customers pay you upfront. You have to build the product and spend enough money to acquire customers that will pay you on a monthly subscription basis.
To ensure building a sustainable business you will have to track the recurring revenue instead of monthly. Recurring revenue is tracked on the server side and you would need to look at the measurement protocol for tracking it correctly.
So far you would have gotten an idea of how Google Analytics can revolutionize your SaaS platform. It can be a complete analysis and reporting tool for your business. However, if you still have any confusions you can ask us in the comment section below.
ps. want this done for you? shoot us a message.