After the strong interest to my previous in-depth Looker Studio tutorial, I am happy to share with you a few more Looker Studio templates that are prebuilt and ready to use.
The Looker Studio template is an all in one marketing and SEO template which includes the most important metrics related to your business. Get a glance of your marketing KPIs without having to login to your Google Analytics account.

What’s Included in the Template
This template consists of seven types of dashboards. It’s made to give you an outline of the most important reports that matter to your business. Below are the seven types of dashboards:
1. Audience Overview
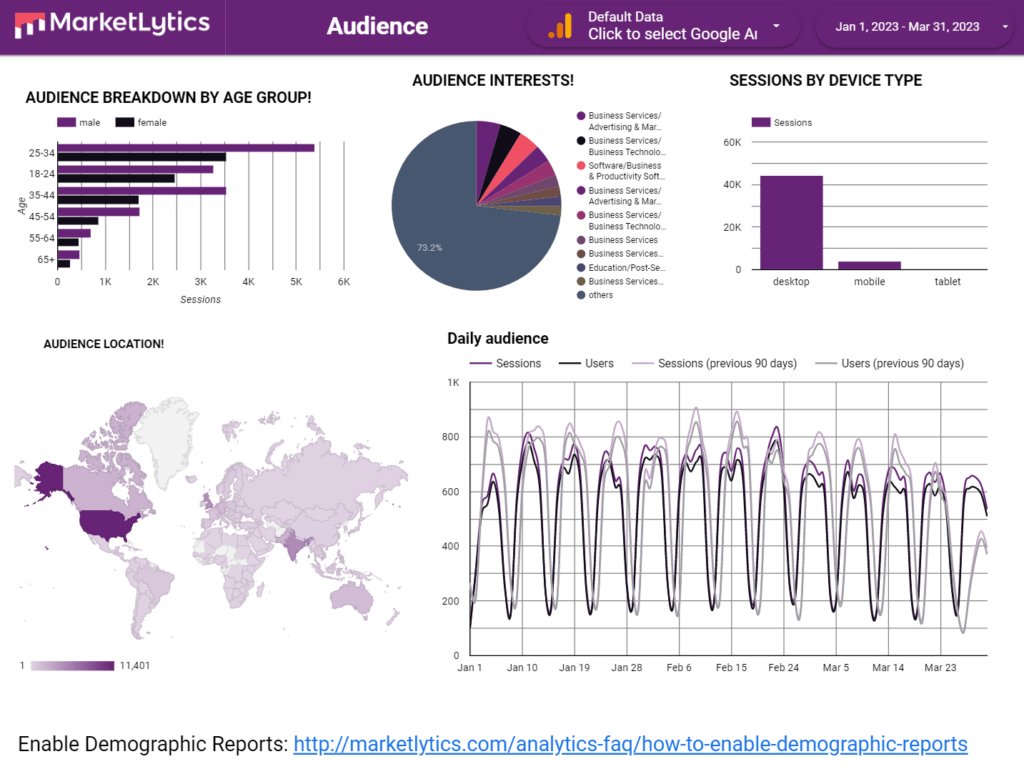
This dashboard displays where in the world your audience lives. It is basically a combination of audience location, gender, and interests reports. Being a content marketer you would be interested to know about your audience and create content around their interest.
2. Acquisition Report

The second important thing to know for any marketer is the source of traffic. Which channel is bringing in more traffic, which campaigns are out performing and which other websites refer traffic to your site.
You will see a glimpse of all the above things in the acquisition dashboard.
3. Behavior Report

Are you able to impress your website visitors? Do they stay longer and interact with your content? These are really important questions that conclude your business success. This dashboard displays the top performing pages, the top events, and browsers which your visitors use to access your website.

4. Conversions Report

The success of your online business can be measured by the number of goal completions. It can be a pdf download, newsletter sign up, or a form submission. This dashboard will help you have a look at important goal conversions and which traffic sources play an important part in goal completions.
5. Social Media Report

Social media alone is a powerful traffic source for your business. It can lift your online business if managed successfully. In this template, you will be able to see the top social media channels, social media visitors behavior, bounce rate, peak days and hours.
6. SEO Template

SEO is the backbone of any online business. The SEO dashboard one of the interesting report for any online marketer. It gives new opportunities to rank and beat the competitors. This report is based on search console data, make sure to add both search console sources i.e Search Console Data(URL) & Search Console Data(Site). If any dashboard isn’t displaying data try changing the search console data source.
Get Your Free Looker Studio Template
If you don’t know using a template, I’ll walk you through the whole process to connect with your own data source and analyze data. Follow the steps below to use the template:
1. Create a Looker Studio Account
Before importing the template, it is required that you have a Looker Studio account. If you haven’t created yet, click here to create one.
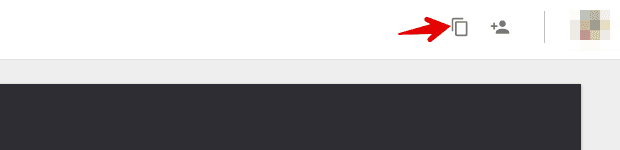
2. Get the template and make a copy
Click on the below button to get looker studio marketing template and create a copy.
3. Connect Data Sources – Google Analytics & Search Console
This template uses two data sources. One Google Analytics and second is search console for SEO reports.
connect Google Analytics and search console data sources.
For adding analytics, from the data sources list, select Google Analytics and then choose the specific account, property, and view which you want to connect.
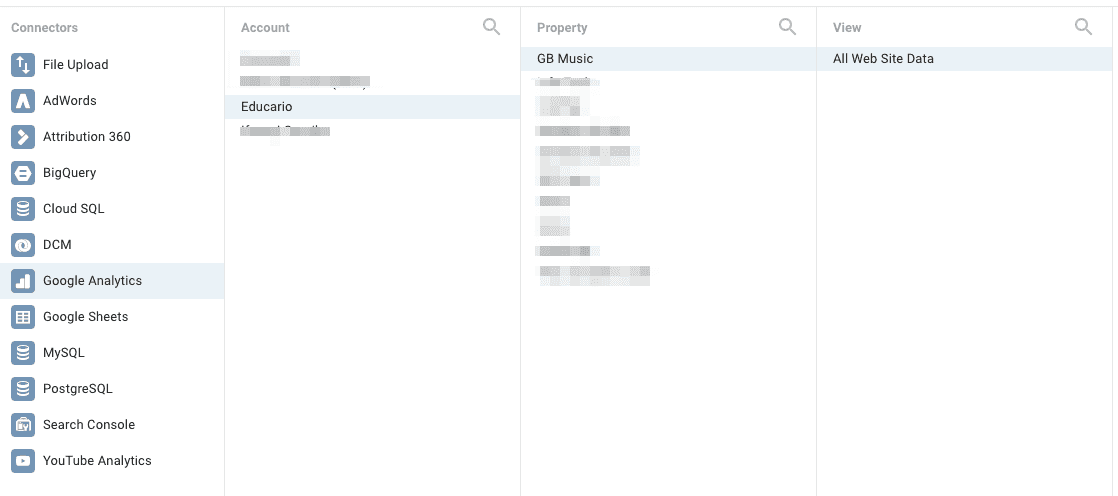
Click the connect button.
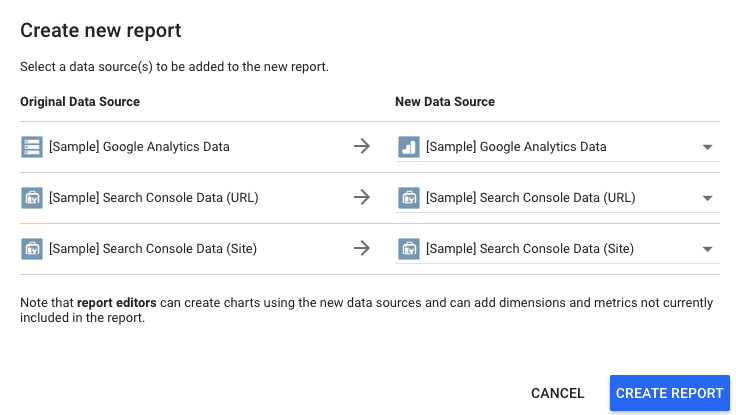
Next, add all the listed dimensions and metrics by clicking the ‘ADD TO REPORT’ button.
Similarly, add the second data source as Google Search Console and hit ‘CREATE REPORT’.
Note: If any of the report/dashboard isn’t displaying data, click on that specific dashboard and look for the data source, dimension, metrics and change them according to your data.
View your Marketing Dashboard
Once you setup the data sources and create a report, you will be taken to your reports dashboard. It includes 7 pages, so you can click on the pagination icon to view multiple reports in the same dashboard.
Now, you have a working dashboard and it’s easier to view the summary of all your important data in a single template. Don’t forget to comment below, your thoughts about the template and how it can be improved further to meet your business goals.
Note: Check out our new ecommerce template.